


Let’s say we have an issue in production. We’ve all been there, right? The first thing we want to be able to do is reproduce errors and issues. By reproducing errors, we can confirm it’s a recurring issue, rather than a sporadic one, and that it requires a fix to ensure that our product is working properly.
When shifting from a monolith to microservices, the ability to reproduce errors becomes more of a challenge. Reproduction in monoliths is easy – most entry points are simple HTTP calls and there is just one service.
But reproducing issues in distributed systems is harder. When noticing an issue in a flow which involves service A, service B, databases, Kafka queues, service C, etc. – identifying the root cause of the issue is much more complex.
Today, developers often use logs and metrics with production monitoring solutions like Sentry or Airbrake. Once they get an alert, they parse the logs, copy the data into their UI or CLI, attempt a manual call at the endpoint, scrape information and eventually somehow find out they were missing a token or a header. The challenge is that solutions like Sentry don’t provide context. They lack information like who made the call, which makes reproducing issues more difficult.
In this blog post we’ll show you how to use distributed tracing platforms like Helios to see the traces and spans (span = an operation in the system, trace = a collection of connected spans), use them to modify requests when reproducing and gain visibility into the system.
We will show how to reproduce issues in different four ways:
- Code – a Python or JavaScript Script
- cURL
- Postman
- Helio’s CLI
Let’s get started! You can watch the video.
1. Reproduce Errors and Issues in Microservices with Python or JavaScript
Our trace provides us with all contextual data of the requests, like payloads, attributes and data flows inside the system. It also shows the errors. In the image below, you can see the error we will be reproducing: “Invalid Currency Bitcoin”:

One option to reproduce issues is to write a Python or JavaScript script that will recreate the original call with the headers, body, the URL, etc.
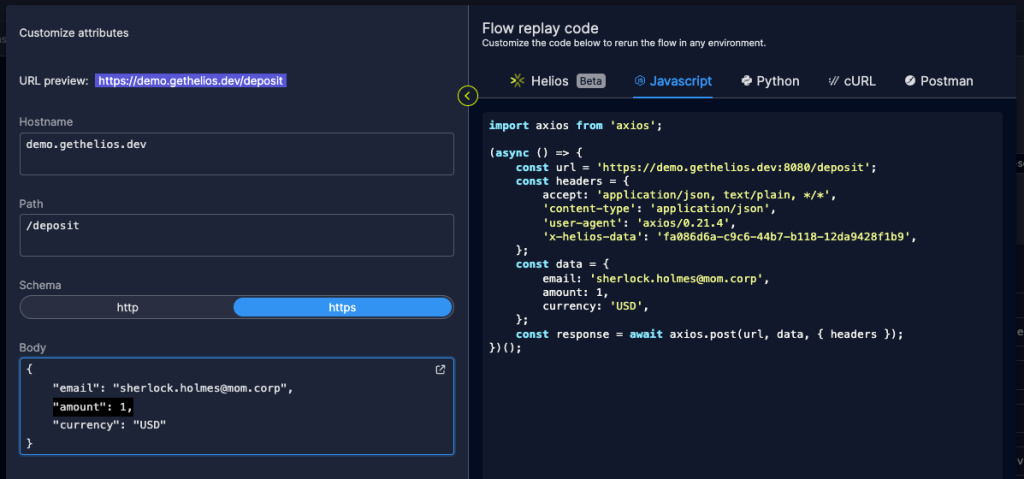
Helios now enables automatically generating the script straight from Helios. The code, available in either Python or JavaScript, already has all the payloads and errors in it and is ready for modification and running.
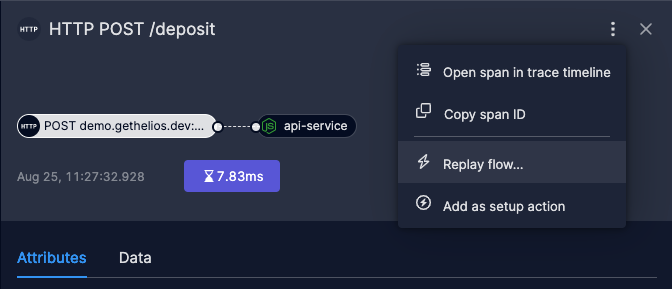
- Open the trace
- Click on the thunder icon – “Replay flow”

You will see this screen with the code:

4. Save the code and run it.
5. Modify the parameters to ensure reproduction. For example:
– Configuring to the local environment

– Solving SSL issues:

– Creating users
– Changing users
– And more
(Changes can also be made straight in Helios).
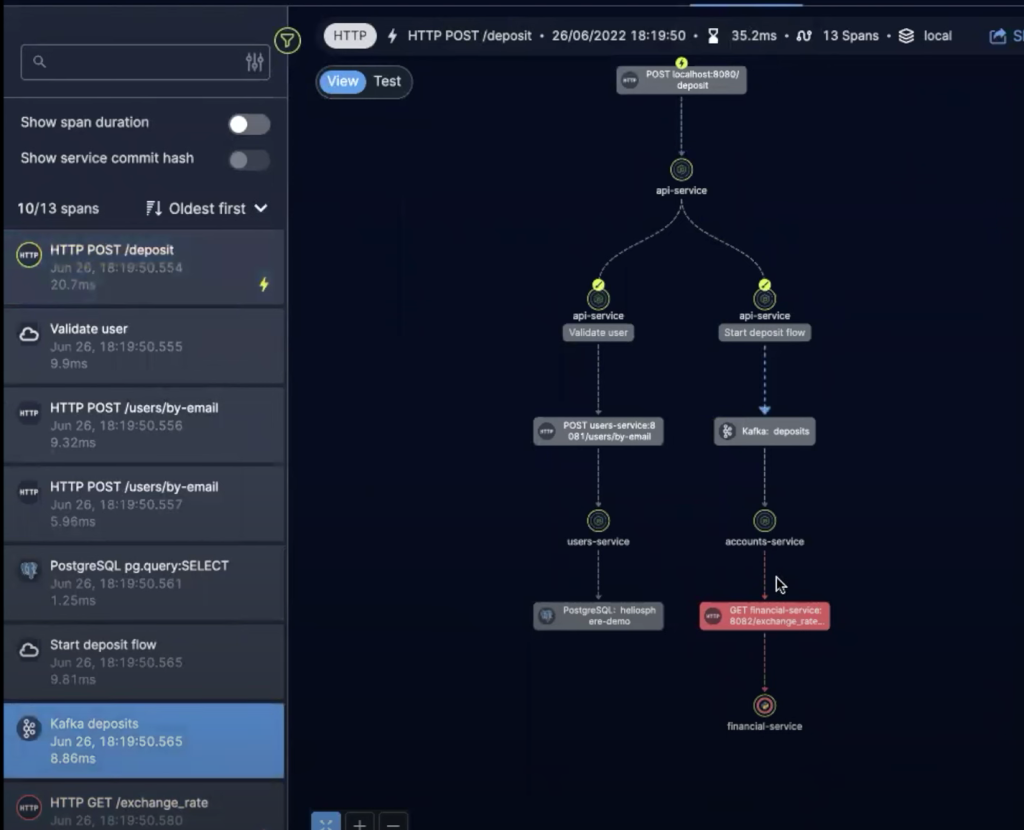
6. Once the changes are made, track and visualize the traces in Helios again to ensure the issue was resolved:

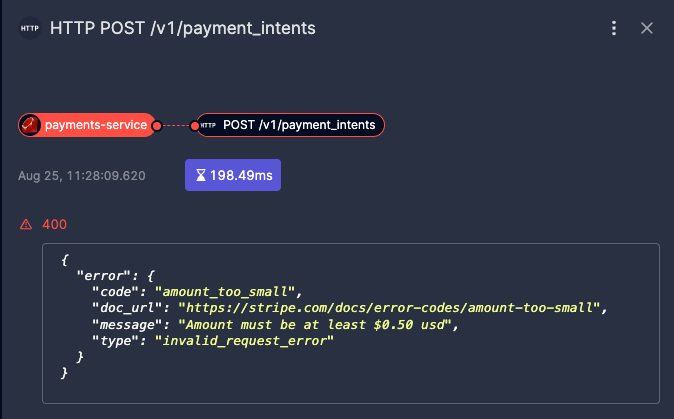
The request we modified is now ok, but there is another error in a request to the payment service that caused the call to fail.
7. Open the trace:

8. Generate the trigger code for the whole flow:
9. Make any required changes, in this case – change the amount to pass the minimum:
10. When printing the status code, Helios provides request information from deep inside the call:
This provides more information in just a few minutes than any production monitoring tool, enabling fast troubleshooting, debugging, and issue resolution.
2. Reproduce Errors and Issues in Microservices with cURL
Not everyone likes to use complex code to reproduce their issues. Maybe you’re a cURL type of person. This time we will look at using cURL to reproduce the call.
11. Generate a trigger code like before. But this time, choose the cURL option:
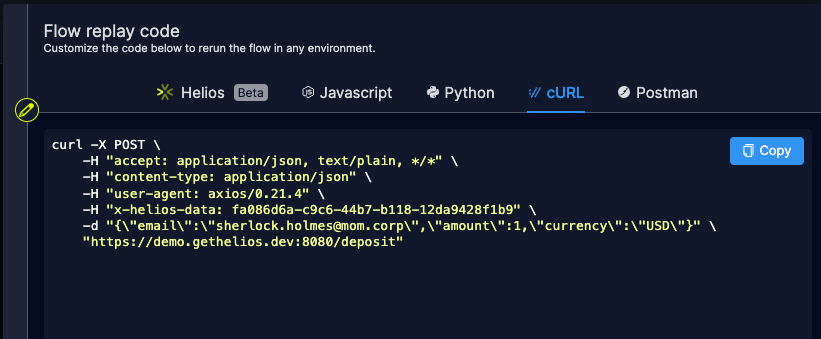
12. Modify any relevant parameters, like the host or the body.
13. Copy the command and run it.
14. You will see new, modified traces in Helios:
3. Reproduce Errors and Issues in Microservices with Postman
Helios also works with Postman and lets you reproduce and troubleshoot issues there.
15. Open Postman and create a new HTTP request:

16. To fill in the parameters, go back to the trace in Helios and generate the trigger code.

17. Import the code into Postman.

18. The code can be modified straight in Postman:

19. Go back to Helios and see the resolved changes in action:

4. Reproduce Errors and Issues in Microservices with Helios CLI
If you don’t want to use third-party solutions, Helios also lets you use its own CLI to trigger the call.
20. Modify the generated code straight in Helios:

21. Execute and run in Helios:

You can make as many changes as you need until they are all reproduced and resolved.
Helios provides a free tier solution for developers looking to easily reproduce microservices issues. Start now.


