

How applying API observability based on instrumented data helps developers debug issues faster and boost productivity when building distributed applications.
APIs provide a way to simplify development, reduce costs, and create more flexible and scalable applications. Much of today’s development relies on APIs – in the integration of third-party services, in the communication between microservices, in mobile app development, and in other use cases. Some APIs even exist as products themselves for customers to use. However, as with other components in distributed architectures, it’s often hard to have control and visibility over all your APIs across all microservices, and understand where they are used and how. Helios improves the developer experience by providing API observability and troubleshooting tools based on actual (instrumented) data, giving you visibility into your API inventory, specs & runs and helping you identify and debug issues instantly. In this blog post I share my experience as a developer at Helios using API observability features in the Helios platform to monitor and troubleshoot our own application, and to deliver a more reliable and high-performing product to our customers.
Specifically, I will cover how we apply API observability in Helios to save time and increase developer productivity in the following ways:
- Using an auto-generated API catalog, enabling discovery of the entire API inventory used by an application
- Using API overview and spec tools, providing access to API documentation and performance as calculated automatically based on instrumented API calls
- API troubleshooting, allowing immediate access to different kinds of API errors and failures – including the full E2E context coming from distributed tracing and context propagation
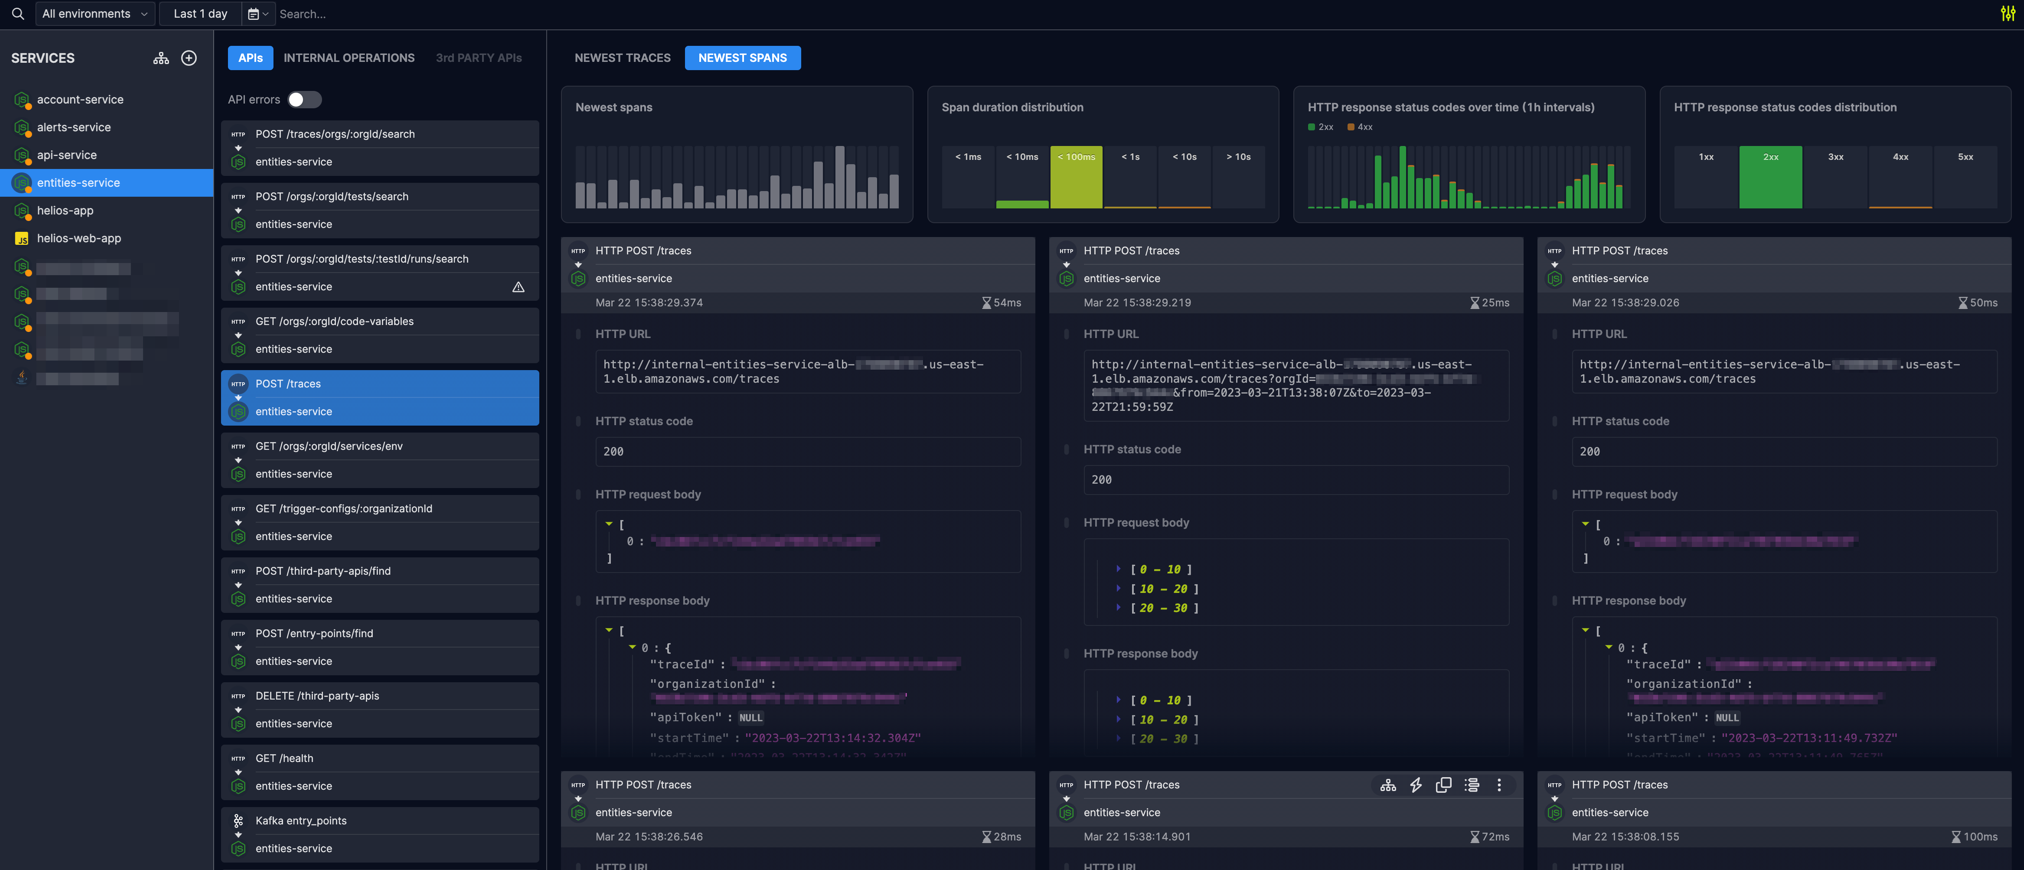
Auto-generated API catalog
In the Helios platform, we created a tab called APIs which shows you an auto-generated API catalog. This is based on data received from the instrumentation of your microservices in action, rather than from a developer’s (static) documentation of the APIs. Often, developers or architects aren’t aware of all the APIs that exist in an application over time, whether used internally or even customer-facing. Dev leads, architects, QA teams, DevOps teams and of course developers need to know what APIs exist, how they are used and how they can be extended. Based on service instrumentation, you can see what’s happening with your API inventory on the ground: what APIs are used, how frequently, by what entities, and according to what specification. Helios leverages OpenTelemetry (OTel), an open-source collection of tools, APIs, and SDKs for creating and gathering telemetry data, for data instrumentation. The core benefit of Helios’ visibility into your API catalog is that it’s driven by what is actually happening; on top of that you can take actions for faster turnaround times.
As the API catalog is automatically generated, also the specification of each API is inferred based on actual traffic and how the APIs are used – in any environment where the instrumentation is used. Recall Hyrum’s law:
With a sufficient number of users of an API, it does not matter what you promise in the contract: all observable behaviors of your system will be depended on by somebody.
Automatic creation of API specs based on instrumented traffic spares you from having to record – and maintain! – them in a labor-intensive way to accurately account for API parameters, headers, and API data models (for requests and responses).
Example 1: API discovery
We recently added a new alerts-service to our architecture. The service’s purpose is to send alerts to our users based on trends of traces, new services in their system, and more. The new service needs to perform API calls to our entities-service in order to retrieve data.
First off, it was very easy to search the API inventory and look up the available APIs.
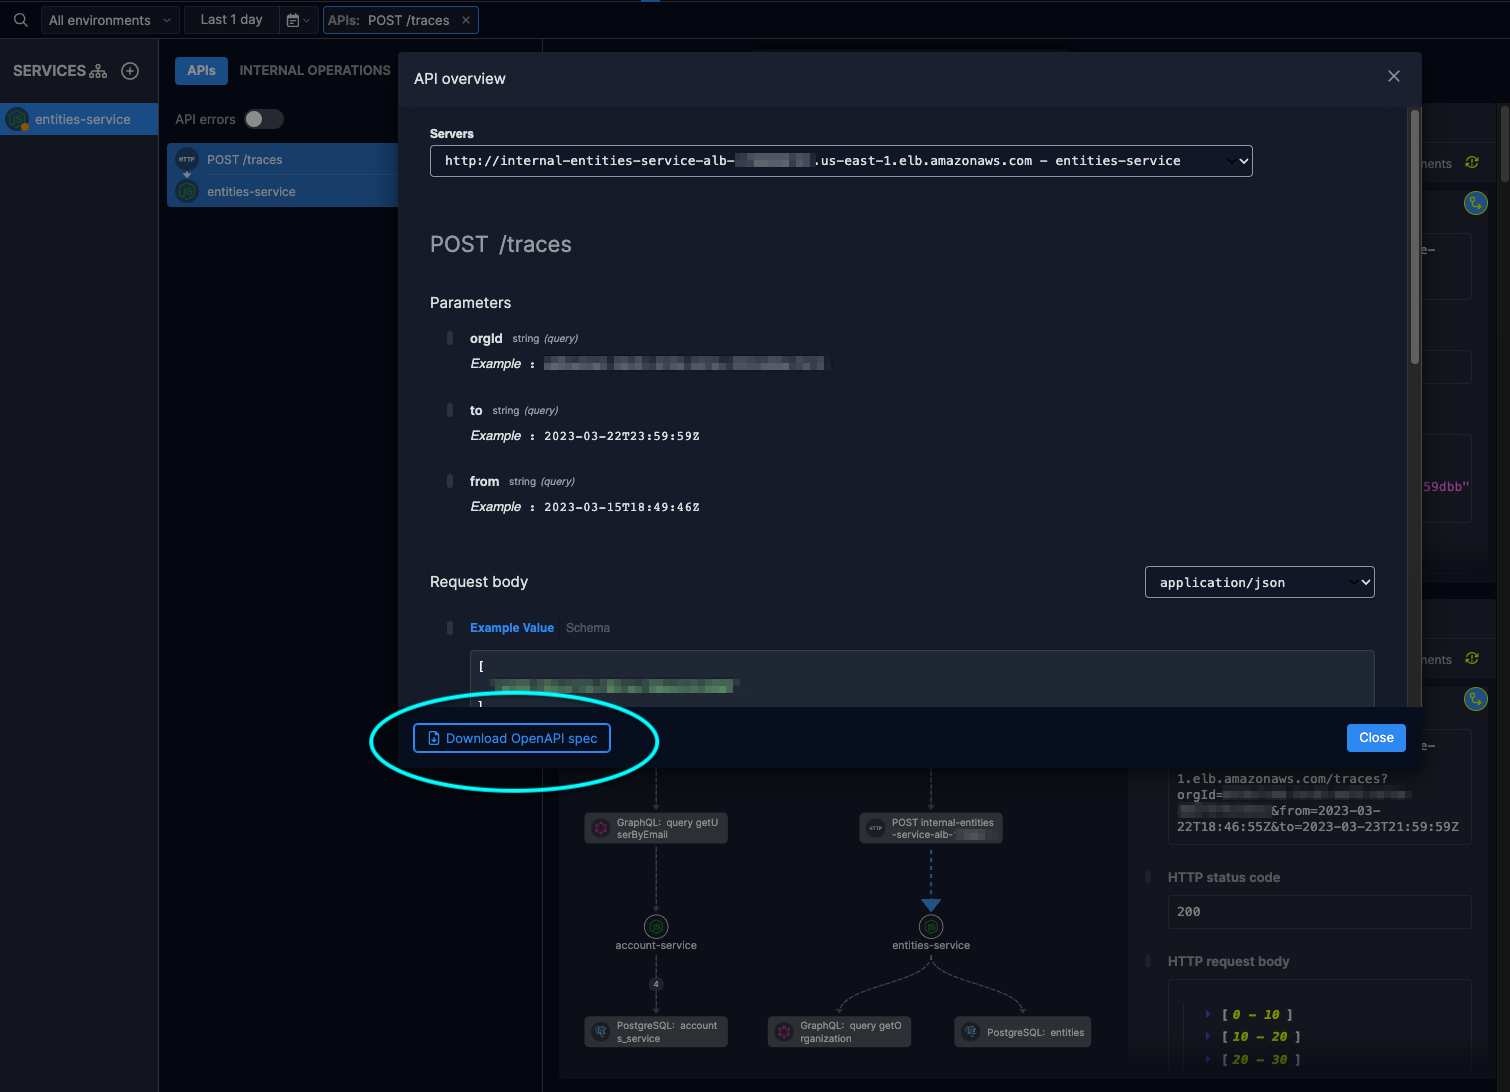
Then, I inspected the auto-generated API spec to get the characteristics of the needed API in order to create the client in the new service. Specifically, I wanted to utilize the traces API in the entities-service to get specific traces, so instead of going to the codebase and looking up the required usage of the API – I simply used the spec in Helios.
In a matter of seconds, I was able to create the required client in the new service with the relevant spec, because I know what the required parameters and request body schema are.
API overview and spec
For each API, Helios automatically generates a spec by looking at all the actual API calls (spans) and inferring their configuration and de-facto specifications. This is valuable for making sure that your API’s spec & parameters are aligned with how it’s defined in the organization (in terms of the naming convention, data format, etc.) and for checking that the API meets compliance and security standards. It’s also extremely valuable when fellow developers attempt to figure out how to use a certain API. Architects and developers also want to make sure that the behavior of the API continues as it should over time.
However, enforcing the API spec requires a lot of manual work, reviews, and processes, which can sometimes get complex. We took the UI of OpenAPI Specification (previously known as the Swagger Specification), which is open source, and we implemented it into our platform so that it’s easily available when looking at each API.
Example 2: Validating APIs using openapi-validator and the OpenAPI spec provided by Helios
Most of our services are written in Node.js with Express.js as the web application framework. Express has an openapi-validator to perform validations on the request and response upon providing an OpenAPI spec:
app.use(
   OpenApiValidator.middleware({
      apiSpec: './openapi.yaml',
      validateRequests: true, // (default)
      validateResponses: true, // false by default
   }),
);
I used the OpenAPI spec automatically generated in Helios for each API, to perform validations on our APIs.
Without the spec being automatically generated I would have had to manually create the spec for each API we want to validate – and maintain it over time. This is needed for tens and hundreds of different APIs. The generated spec helps to validate any API in the system in seconds.
API troubleshooting
API issues are usually related to an increase in error rates or latency, and this can impact business performance. This is where Helios API troubleshooting comes in. Helios provides a dashboard for each specific API in your catalog. You get access to widgets which show you trends in your recent spans, duration distribution, HTTP response status code, errors & failures, and more. With the visibility into your API catalog and the ability to filter APIs by errors, so you can go straight to the problematic API calls and debug them. Another great benefit is the full E2E context of each API call thanks to distributed tracing, allowing to investigate what happened with the most relevant context and flow-drive mindset. These features – from seeing where the problem is all the way down to analyzing its root cause – all help to shorten mean time to resolution, reducing frustration for developers (especially if you’re on-call in the middle of the night!).
Example 3: Performing root cause analysis of increase in API latency
Recently, we got a complaint from one of our customers about increased latency in opening trace visualizations. I was assigned to investigate this issue. The flow showing the visualization in our system is composed of various endpoints and involves several services.
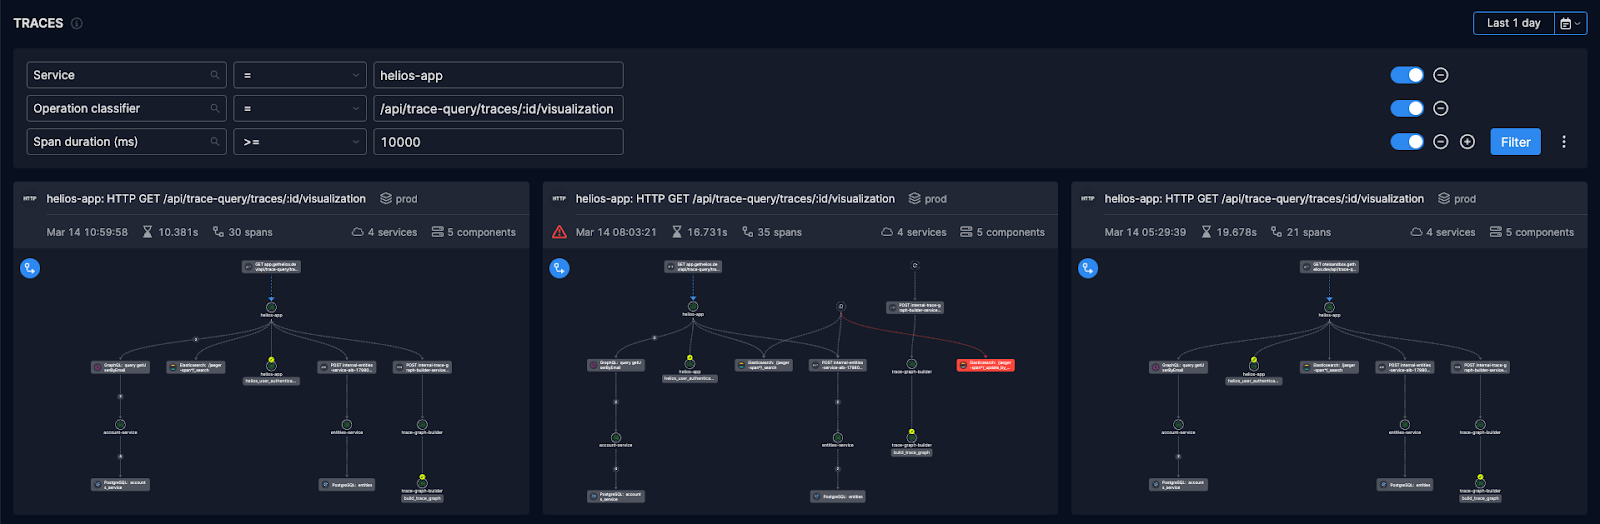
I started with examining the first entry point of the visualization’s API in our main helios-app:
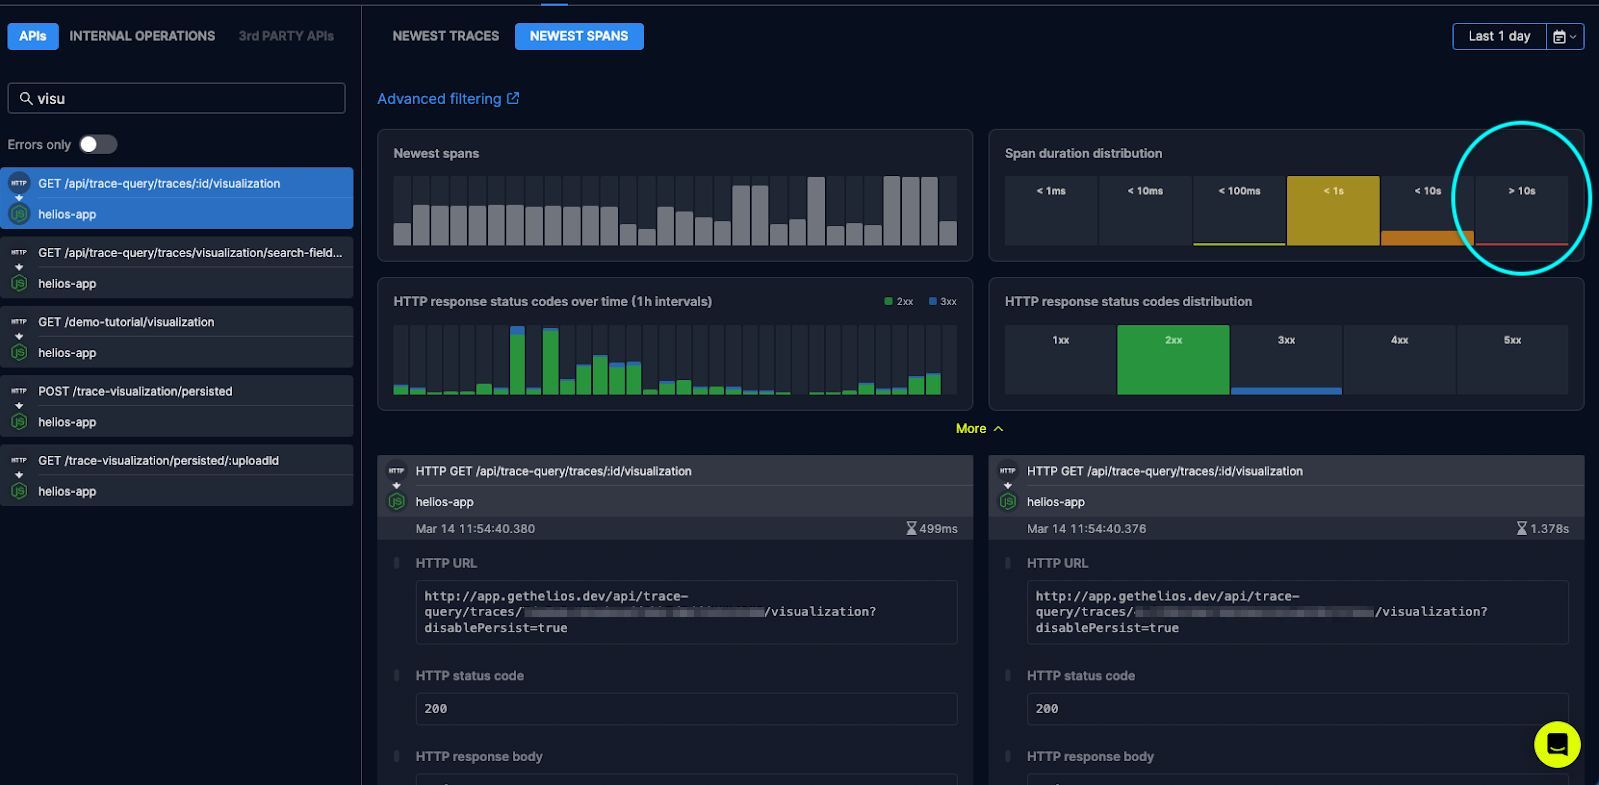
Then I used the Span duration distribution widget and clicked on the bar of the spans that has the longest duration:
Now I was investigating a very minimal subset of traces that could lead me to the potential issue.
I started to investigate the traces by clicking on their visualizations and drilling down into the details. I used the duration feature in our visualization in order to pinpoint the bottlenecks:
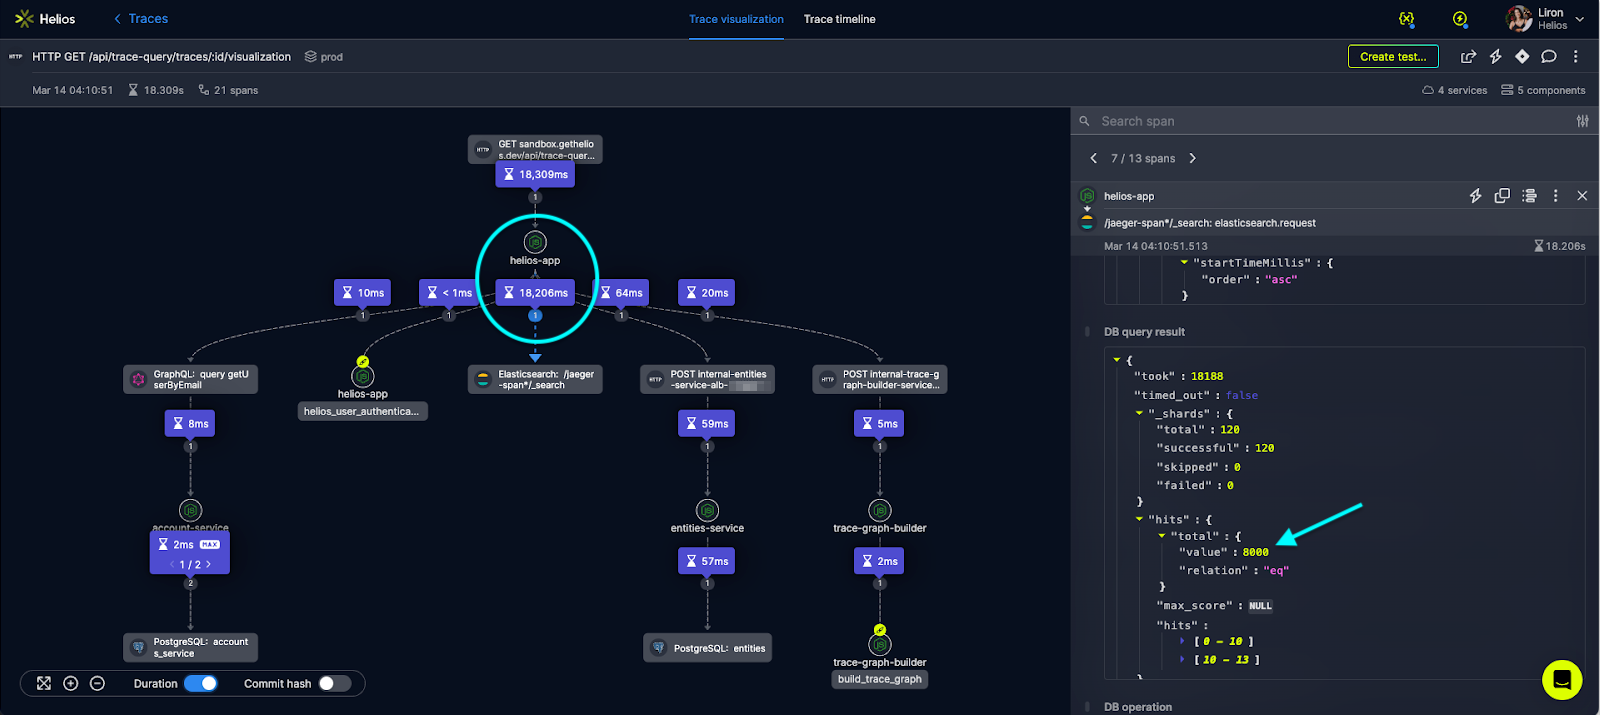
Here I saw that the queries to Elasticsearch were the ones that were taking the most time. I tried to find a trend and checked if this is indeed the issue in all other traces. Investigating other spans showed that the bottleneck is the query to Elasticsearch. From the result in the query, I could see that the duration was the actual time spent on the query (and not some network issue).
I noticed the high number of spans returned in the query (8,000). Even though I suspected this, I wanted to make sure this wasn’t something momentary so I reproduced this locally using flow trigger generation. The issue appeared again. I noticed the high amount of spans was a pattern in all of the ‘longest’ spans. I decided to address the issue by paralyzing this specific query using the Elasticsearch feature to query upon prefixes of specific element fields.
Investigating and debugging such a bug could have taken me much longer than it actually did using the Helios API observability features. I was able to quickly and easily find the needle in the haystack and then replicate the issue, helping me understand the root cause and enabling me to push a fix faster than I could have imagined.
Applying API observability beyond HTTP
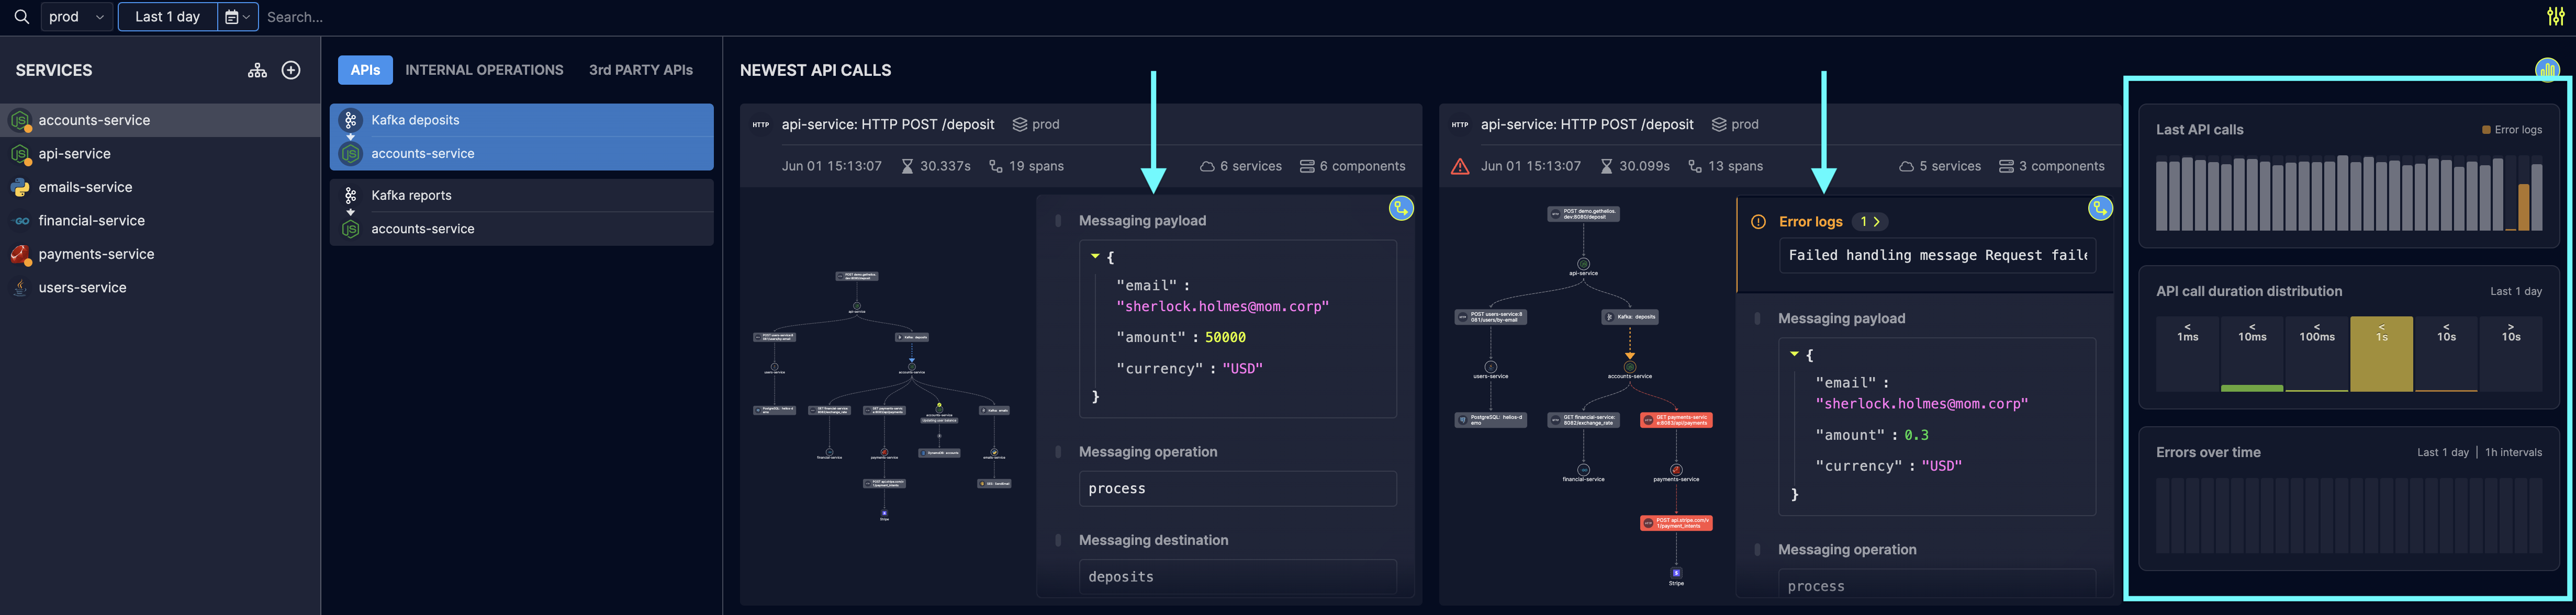
While the notion of APIs in general, and specifically API observability, often relates to HTTP communication – there are other components in a standard distributed application that expose and interface and that various microservices interact with; for example, databases and messaging queues. Any component instrumented with the Helios SDK comes together as another piece of the distributed trace, and some of the benefits of API observability can be applied as well.
Applying API observability concepts to non-HTTP interactions include providing the full E2E context for each operation, visibility into the payload of the call itself (in the example below – the messaging payload), and trends and statistics for frequency, duration & error rates. Those are extremely useful as well when troubleshooting erroneous flows, that are definitely not limited only to HTTP!
Conclusion: Applying API observability to improve the developer and customer experience
API observability is becoming increasingly important today for understanding how APIs are being used and how they are impacting application/system performance. API issues related to latency and error rate can also affect customer experience. With Helios, API discovery, specification, monitoring and troubleshooting are based on the instrumentation of your microservices, as opposed to a developer’s documentation of the APIs. This actual, instrumented data can be applied to more effectively identify and troubleshoot issues quickly, optimize performance, and improve the customer experience. In this blog post I showed some examples of how I use API observability in Helios as part of my daily routine as a developer to easily and quickly discover, monitor and troubleshoot API issues in Helios. I invite you to try our API observability features for yourself by getting started with Helios for free.


