

What is OpenTelemetry?
OpenTelemetry (OTel), an open-source project under the Cloud Native Computing Foundation (CNCF), is a collection of tools, APIs and SDKs for generating and collecting observability data (mainly trace, metrics and logs) from cloud-native applications. An industry-standard for distributed tracing and observability, OTel enables analyzing application health and performance to ensure production-readiness and support production monitoring. It enables collecting the data in a vendor-agnostic way, and exporting it to any backend of your choice, including APM vendors, databases and other open source backend (e.g., Jaeger and Zipkin).
OTel supports multiple languages: Java, Python, Go, Ruby, C++ and Javascript, among others. In this post, we’ll take a look at how to deploy OTel on your Java service. To support us, we’ll be using Jaeger, a distributed tracing tool for microservices that was originally developed by Uber, as a backend. In the end, we’ll also show how to deploy OpenTelemetry Java with Helios and discuss the added value.
What’s Unique About Java?
Java is one of the most popular programming languages in the world. It enables developers to run their code on any platform that supports the JVM – the java virtual machine. Java code is compiled into bytecode that’s executed by the JVM implementation on each platform. Though Java is the main language that’s compiled into the JVM bytecode, there are several more languages that do so as well like Kotlin, Scala and Clojure.
Unlike Node and Python, Java does not enable overriding implementations at runtime by replacing the implementation of functions (i.e., monkey-patching). Java, however, supports a mechanism called the Java agent – enabling dynamic bytecode modification that essentially enables similar capabilities to the ones we have in Node and Python. The Java agent is a separate JAR that’s provided as an argument to the application JAR and performs the instrumentation.
OpenTelemetry Java – OTel Java
Tools like byte buddy, on which the OpenTelemetry instrumentation relies on in Java, make it easier to define the relevant hooks for wrapping function implementations. In this example for the Elasticsearch client from the OTel instrumentation project, you can see how the instrumentation is defined:
/*
* Copyright The OpenTelemetry Authors
* SPDX-License-Identifier: Apache-2.0
*/
package io.opentelemetry.javaagent.instrumentation.elasticsearch.rest.v7_0;
import static io.opentelemetry.javaagent.bootstrap.Java8BytecodeBridge.currentContext;
import static io.opentelemetry.javaagent.instrumentation.elasticsearch.rest.v7_0.ElasticsearchRest7Singletons.instrumenter;
import static net.bytebuddy.matcher.ElementMatchers.isMethod;
import static net.bytebuddy.matcher.ElementMatchers.named;
import static net.bytebuddy.matcher.ElementMatchers.takesArgument;
import static net.bytebuddy.matcher.ElementMatchers.takesArguments;
import io.opentelemetry.context.Context;
import io.opentelemetry.context.Scope;
import io.opentelemetry.javaagent.extension.instrumentation.TypeInstrumentation;
import io.opentelemetry.javaagent.extension.instrumentation.TypeTransformer;
import io.opentelemetry.javaagent.instrumentation.elasticsearch.rest.ElasticsearchRestRequest;
import io.opentelemetry.javaagent.instrumentation.elasticsearch.rest.RestResponseListener;
import net.bytebuddy.asm.Advice;
import net.bytebuddy.description.type.TypeDescription;
import net.bytebuddy.matcher.ElementMatcher;
import org.elasticsearch.client.Request;
import org.elasticsearch.client.Response;
import org.elasticsearch.client.ResponseListener;
public class RestClientInstrumentation implements TypeInstrumentation {
@Override
public ElementMatcher<TypeDescription> typeMatcher() {
return named("org.elasticsearch.client.RestClient");
}
@Override
public void transform(TypeTransformer transformer) {
transformer.applyAdviceToMethod(
isMethod()
.and(named("performRequest"))
.and(takesArguments(1))
.and(takesArgument(0, named("org.elasticsearch.client.Request"))),
this.getClass().getName() + "$PerformRequestAdvice");
transformer.applyAdviceToMethod(
isMethod()
.and(named("performRequestAsync"))
.and(takesArguments(2))
.and(takesArgument(0, named("org.elasticsearch.client.Request")))
.and(takesArgument(1, named("org.elasticsearch.client.ResponseListener"))),
this.getClass().getName() + "$PerformRequestAsyncAdvice");
}
@SuppressWarnings("unused")
public static class PerformRequestAdvice {
@Advice.OnMethodEnter(suppress = Throwable.class)
public static void onEnter(
@Advice.Argument(0) Request request,
@Advice.Local("otelRequest") ElasticsearchRestRequest otelRequest,
@Advice.Local("otelContext") Context context,
@Advice.Local("otelScope") Scope scope) {
Context parentContext = currentContext();
otelRequest = ElasticsearchRestRequest.create(request.getMethod(), request.getEndpoint());
if (!instrumenter().shouldStart(parentContext, otelRequest)) {
return;
}
context = instrumenter().start(parentContext, otelRequest);
scope = context.makeCurrent();
}
@Advice.OnMethodExit(onThrowable = Throwable.class, suppress = Throwable.class)
public static void stopSpan(
@Advice.Return(readOnly = false) Response response,
@Advice.Thrown Throwable throwable,
@Advice.Local("otelRequest") ElasticsearchRestRequest otelRequest,
@Advice.Local("otelContext") Context context,
@Advice.Local("otelScope") Scope scope) {
if (scope == null) {
return;
}
scope.close();
instrumenter().end(context, otelRequest, response, throwable);
}
}
@SuppressWarnings("unused")
public static class PerformRequestAsyncAdvice {
@Advice.OnMethodEnter(suppress = Throwable.class)
public static void onEnter(
@Advice.Argument(0) Request request,
@Advice.Argument(value = 1, readOnly = false) ResponseListener responseListener,
@Advice.Local("otelRequest") ElasticsearchRestRequest otelRequest,
@Advice.Local("otelContext") Context context,
@Advice.Local("otelScope") Scope scope) {
Context parentContext = currentContext();
otelRequest = ElasticsearchRestRequest.create(request.getMethod(), request.getEndpoint());
if (!instrumenter().shouldStart(parentContext, otelRequest)) {
return;
}
context = instrumenter().start(parentContext, otelRequest);
scope = context.makeCurrent();
responseListener =
new RestResponseListener(
responseListener, parentContext, instrumenter(), context, otelRequest);
}
@Advice.OnMethodExit(onThrowable = Throwable.class, suppress = Throwable.class)
public static void stopSpan(
@Advice.Thrown Throwable throwable,
@Advice.Local("otelRequest") ElasticsearchRestRequest otelRequest,
@Advice.Local("otelContext") Context context,
@Advice.Local("otelScope") Scope scope) {
if (scope == null) {
return;
}
scope.close();
if (throwable != null) {
instrumenter().end(context, otelRequest, null, throwable);
}
// span ended in RestResponseListener
}
}
}
Note that:
- The
typeMatchermethod defines the class that is instrumented (in this case, Elasticsearch’sRestClient). - The
transformmethod defines which class methods are to be instrumented (performRequestandperformRequestAsync). - The
PerformRequestAdviceandPerformRequestAsyncAdviceclasses provide the instrumentation implementation of the methods, specifying the hooks to run before (@Advice.OnMethodEnter) and after (@Advice.OnMethodExit) the method execution.
Getting Started with OTel, Java, and Jaeger – Trace-Based Observability
To deploy OTel with Java, follow these steps:
- Download the OTel agent jar from the OpenTelemetry Java instrumentation Github repository here.
- Run your application alongside the agent jar by either:
- Adding a
---javaagent:/path/to/java/agent.jarto your existing command (e.g.,java --javaagent:agent.jar -jar app.jar) - Adding a
JAVA_TOOL_OPTIONSvariable to your environment, containing the same value (e.g.,--javaagent:/path/to/java/agent.jar)
- Adding a
- Export the data to Jaeger. Run Jaeger locally by calling
docker run -d --name jaeger -e COLLECTOR_ZIPKIN_HOST_PORT=:9411 -p 5775:5775/udp -p 6831:6831/udp -p 6832:6832/udp -p 5778:5778 -p 16686:16686 -p 14250:14250 -p 14268:14268 -p 14269:14269 -p 9411:9411 jaegertracing/all-in-one:1.38 - Configure the OTel agent with the following environment variables:
OTEL_SERVICE_NAME: the name of the serviceOTEL_TRACES_EXPORTER=jaegerOTEL_EXPORTER_JAEGER_ENDPOINT=http://localhost:14250
Configuring the OpenTelemetry Java instrumentation agent
Most OpenTelemtery language SDKs can be further configured programmatically. For example, here’s what configuring the Node.js HTTP instrumentation looks like. However, as explained above, Java is different – it’s not possible to configure the different instrumentations with code, as the instrumentation is done using a Jar file that’s compiled in advance. There are three methods for configuring the agent:
Option 1: Environment Variables
This basic method relies on configuring the resource attributes, the export mechanism and the collector endpoint with standard environment variables (as can be seen in the instructions above – the OTEL_TRACES_EXPORTER and OTEL_EXPORTER_JAEGER_ENDPOINT). The agent provides some additional, more advanced env var configurations such as capturing specific HTTP headers, sanitizing DB statements and disabling specific instrumentations.
Option 2: Agent Extension
OpenTelemetry provides an extensions mechanism that enables changing the functionality of the agent without compiling it from scratch. This mechanism supports adding new instrumentations, providing configuration with code, implementing custom processors and exports, and more. This method is obviously more advanced and powerful than the first one, but doesn’t require deep knowledge of the OpenTelemetry instrumentation code.
Open 3: Compiling Your Own Agent
The most advanced method of adapting the instrumentation to your own needs is by recompiling the Java agent from scratch. It enables customization capabilities of the instrumentation, but has its drawbacks of acquiring the knowledge and expertise of working with the OpenTelemetry code directly.
OpenTelemetry Instrumentation with Java – Advanced visibility and richer data
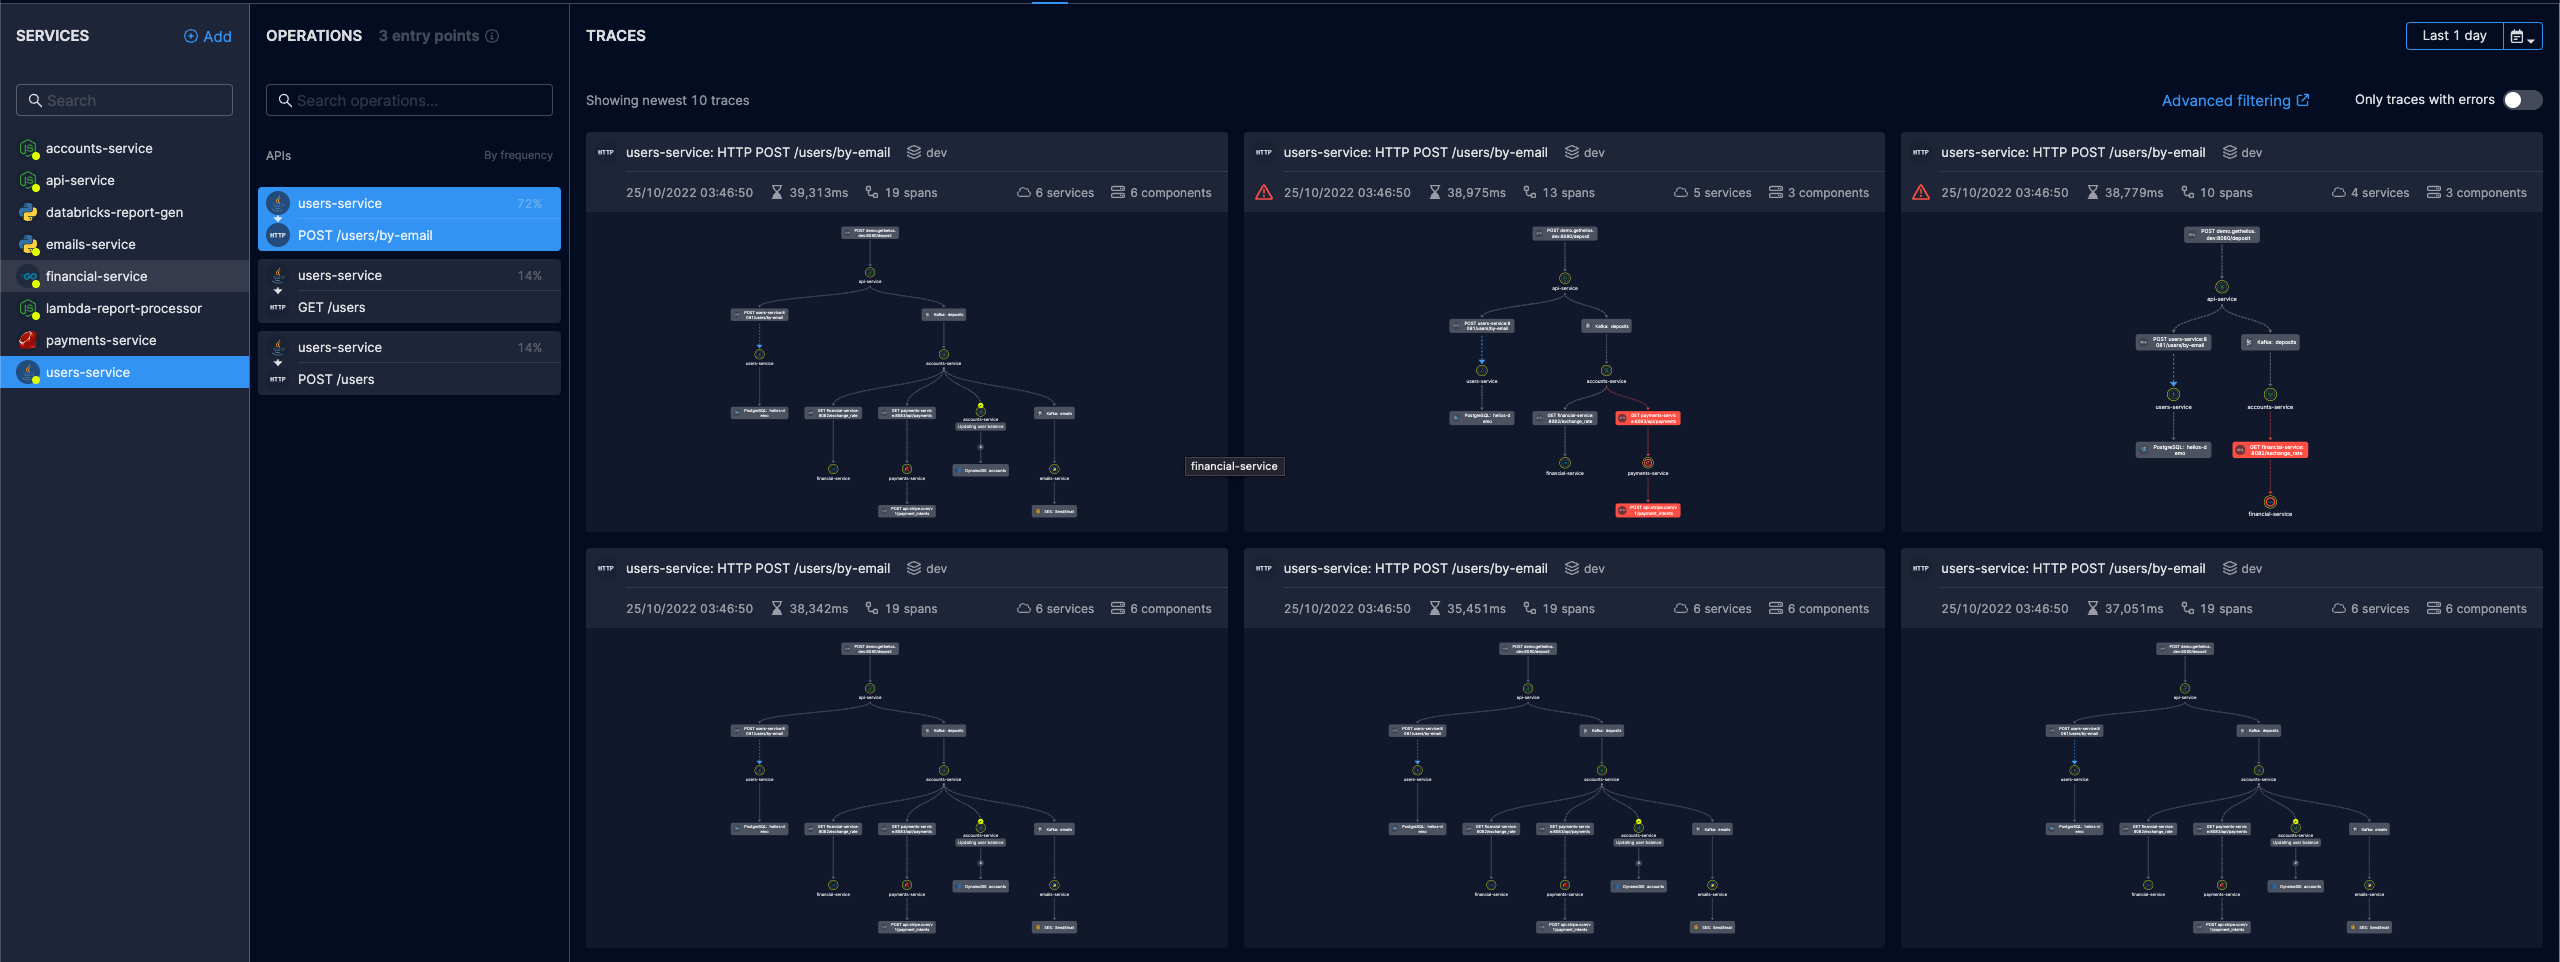
Jaeger provides a basic timeline and traces filtering capabilities. But by deploying OpenTelemetry with Helios, you can use our Java agent to collect more data that helps developers, like HTTP and messaging payloads. Then, you can investigate issues and generate tests for your Java service. Here’s how to do it:
- Download the Helios Java SDK from here.
- Configure the Helios agent with environment variables OR add the jar to your Docker file and run it. See here.
That’s it! Your service will now show up in Helios where you can leverage tracing data from OpenTelemetry and use it for error monitoring and troubleshooting.


