


Integrating distributed tracing into an application has become one of the top initiatives of modern development teams. Here is a framework for how to think about, and evaluate, tracing solutions and their key capabilities.
Adopting a distributed tracing solution to make an application more observable and maintainable is one of the most common key initiatives modern R&D teams have on their plates currently. With the move to microservices architectures, development teams are finding that it’s taking them longer to build applications due to tasks that are growing in complexity. For example, app flows pass through multiple microservices, making it harder to have control and visibility into different application components. In an effort to improve this complex developer experience and improve productivity, developers have turned to distributed tracing, a method for monitoring and understanding the behavior of systems, mainly those composed of multiple microservices. Tracing solutions enable developers to track and analyze the flow of requests across the application, identify bottlenecks in performance, and troubleshoot issues faster.
Not all distributed tracing solutions are created equal. Different tools have different capabilities, like providing visibility into 3rd party API calls, enabling users to access a distributed trace directly from error monitoring, or automatically generating tests based on a flow (a trace). As mentioned before, use of distributed tracing tools is growing today, as is the breadth & depth of new functionality and features in existing and emerging solutions. Some functionality is table stakes, available in solutions across the board; other features can make or break the experience of troubleshooting and testing your distributed applications.
Our team has created a framework to help developers, DevOps teams and analysts evaluate distributed tracing solutions. Within the framework, we include different criteria such as core functionality, developer workflow integrations, deployment, privacy & security, support, and pricing. Our aim is to help educate audiences on the building blocks of distributed tracing today and how they should think about tracing solutions. Below we explore some of the broader categories to provide additional guidance as you use the framework, which can be found here.
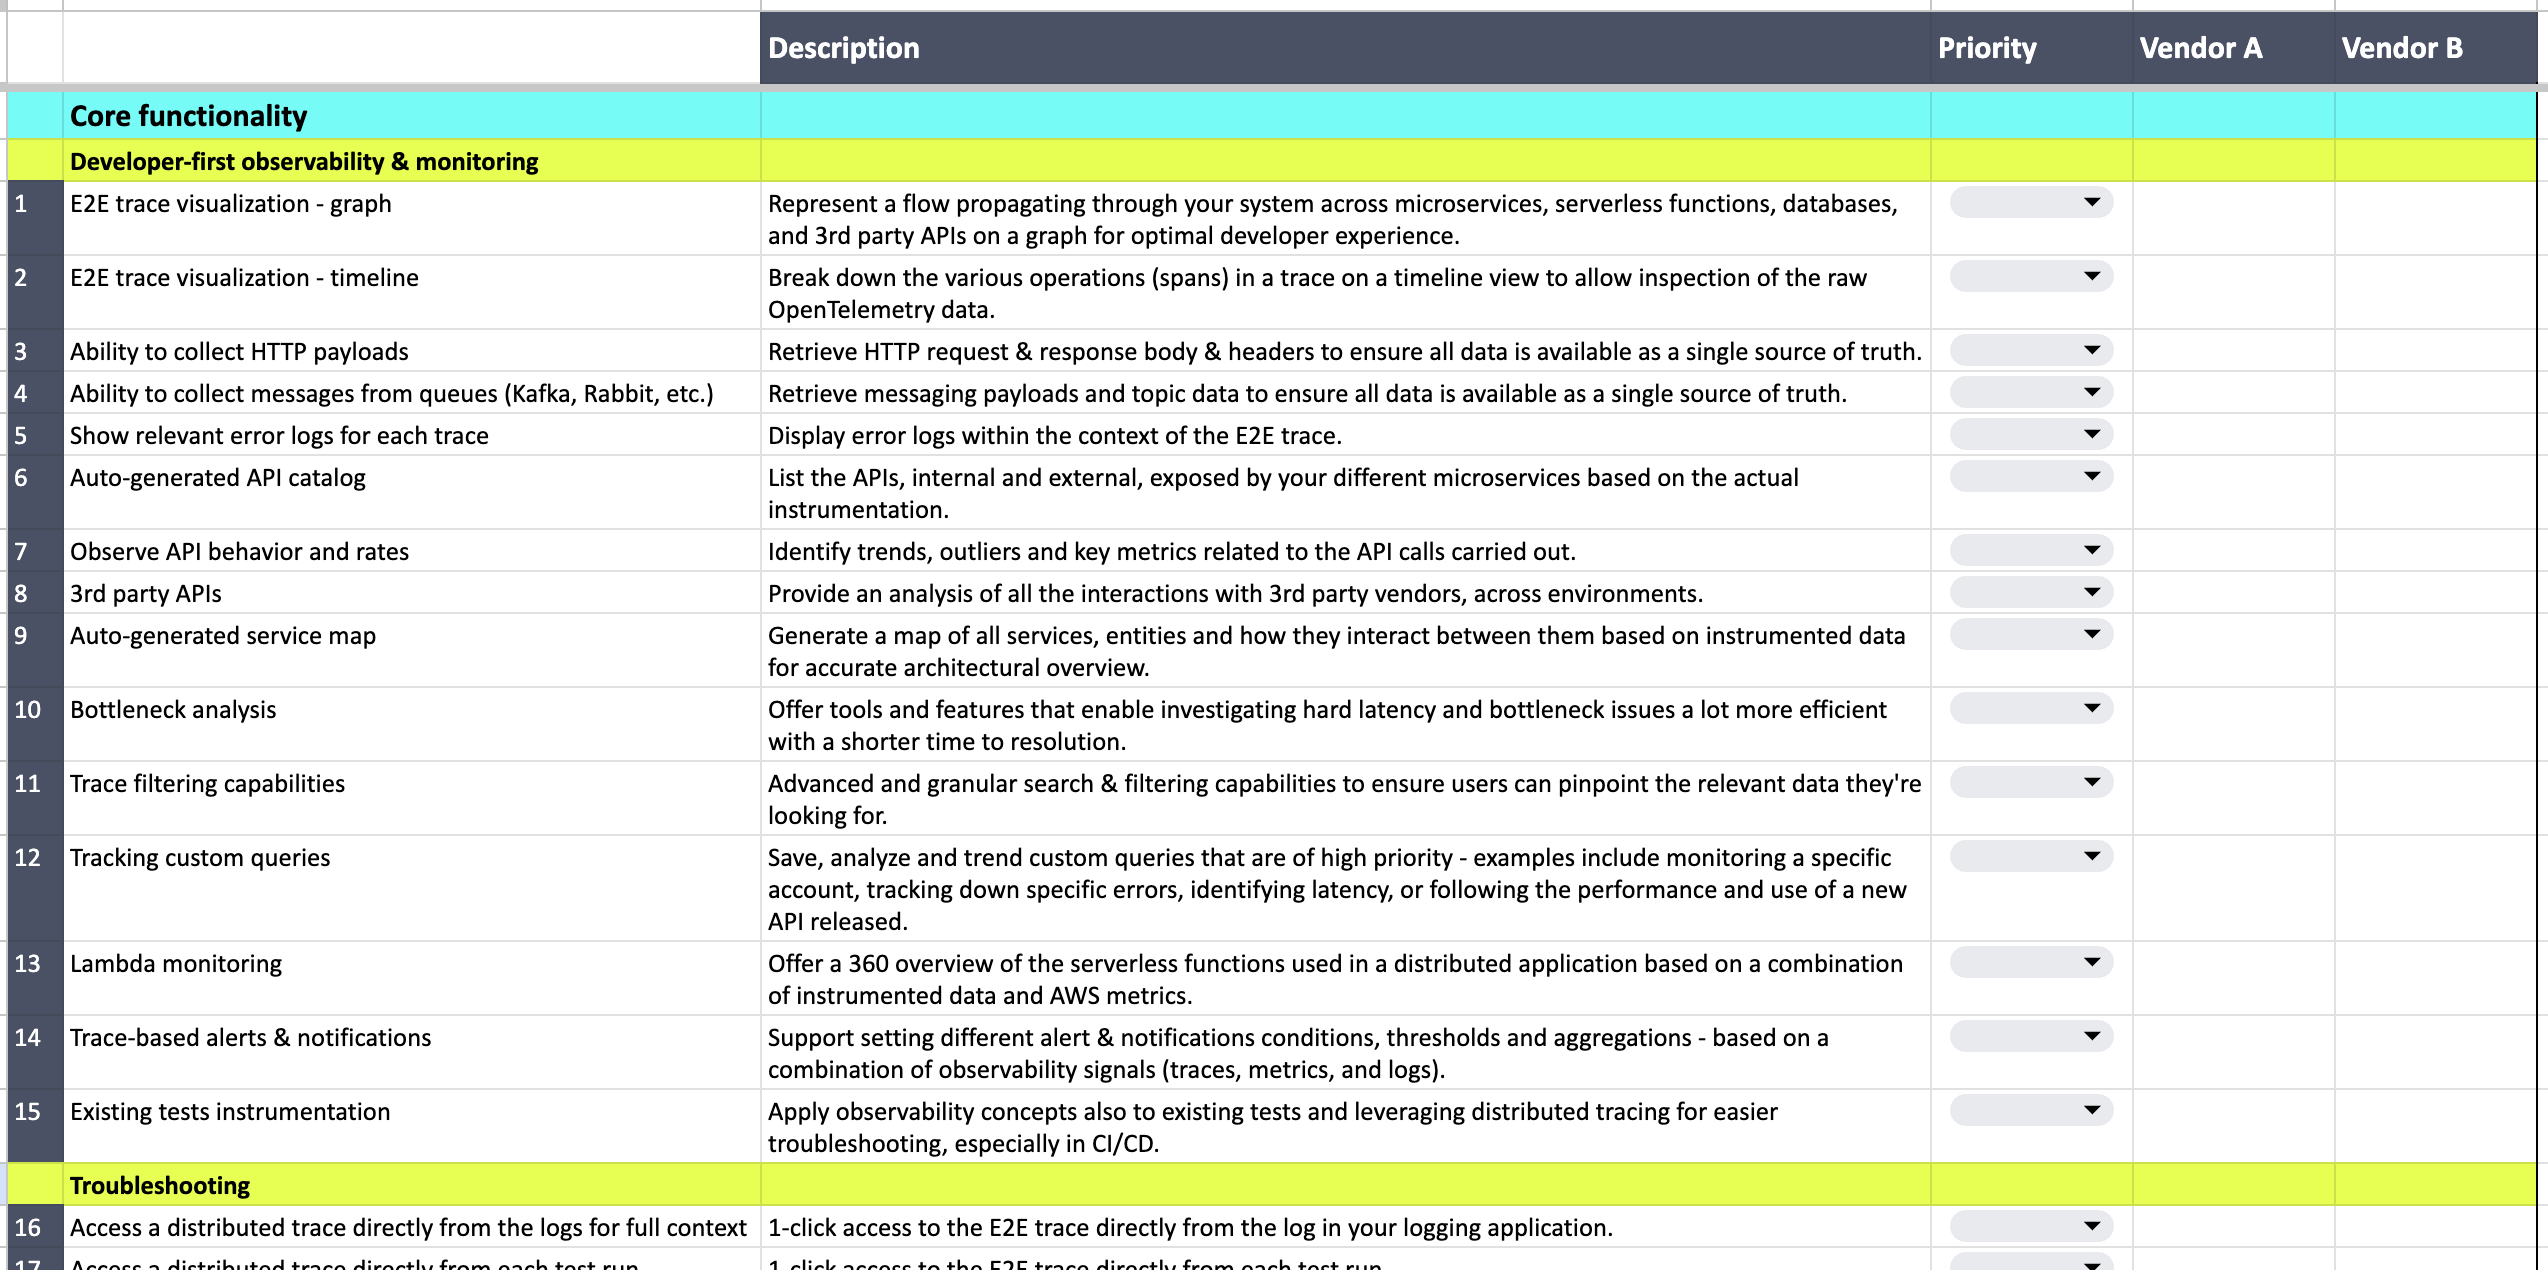
Distributed tracing tool evaluation framework:
- Core functionality of distributed tracing tools (observability & monitoring, troubleshooting, testing, collaboration)
- Developer workflow integrations
- Deployment across services, environments and the entire tech stack
- Privacy & security of instrumented application data
- Support model
- Pricing
Core functionality of distributed tracing tools
Distributed tracing tools will have some combination of functionality across observability, troubleshooting, testing, and collaboration:
- Observability & monitoring
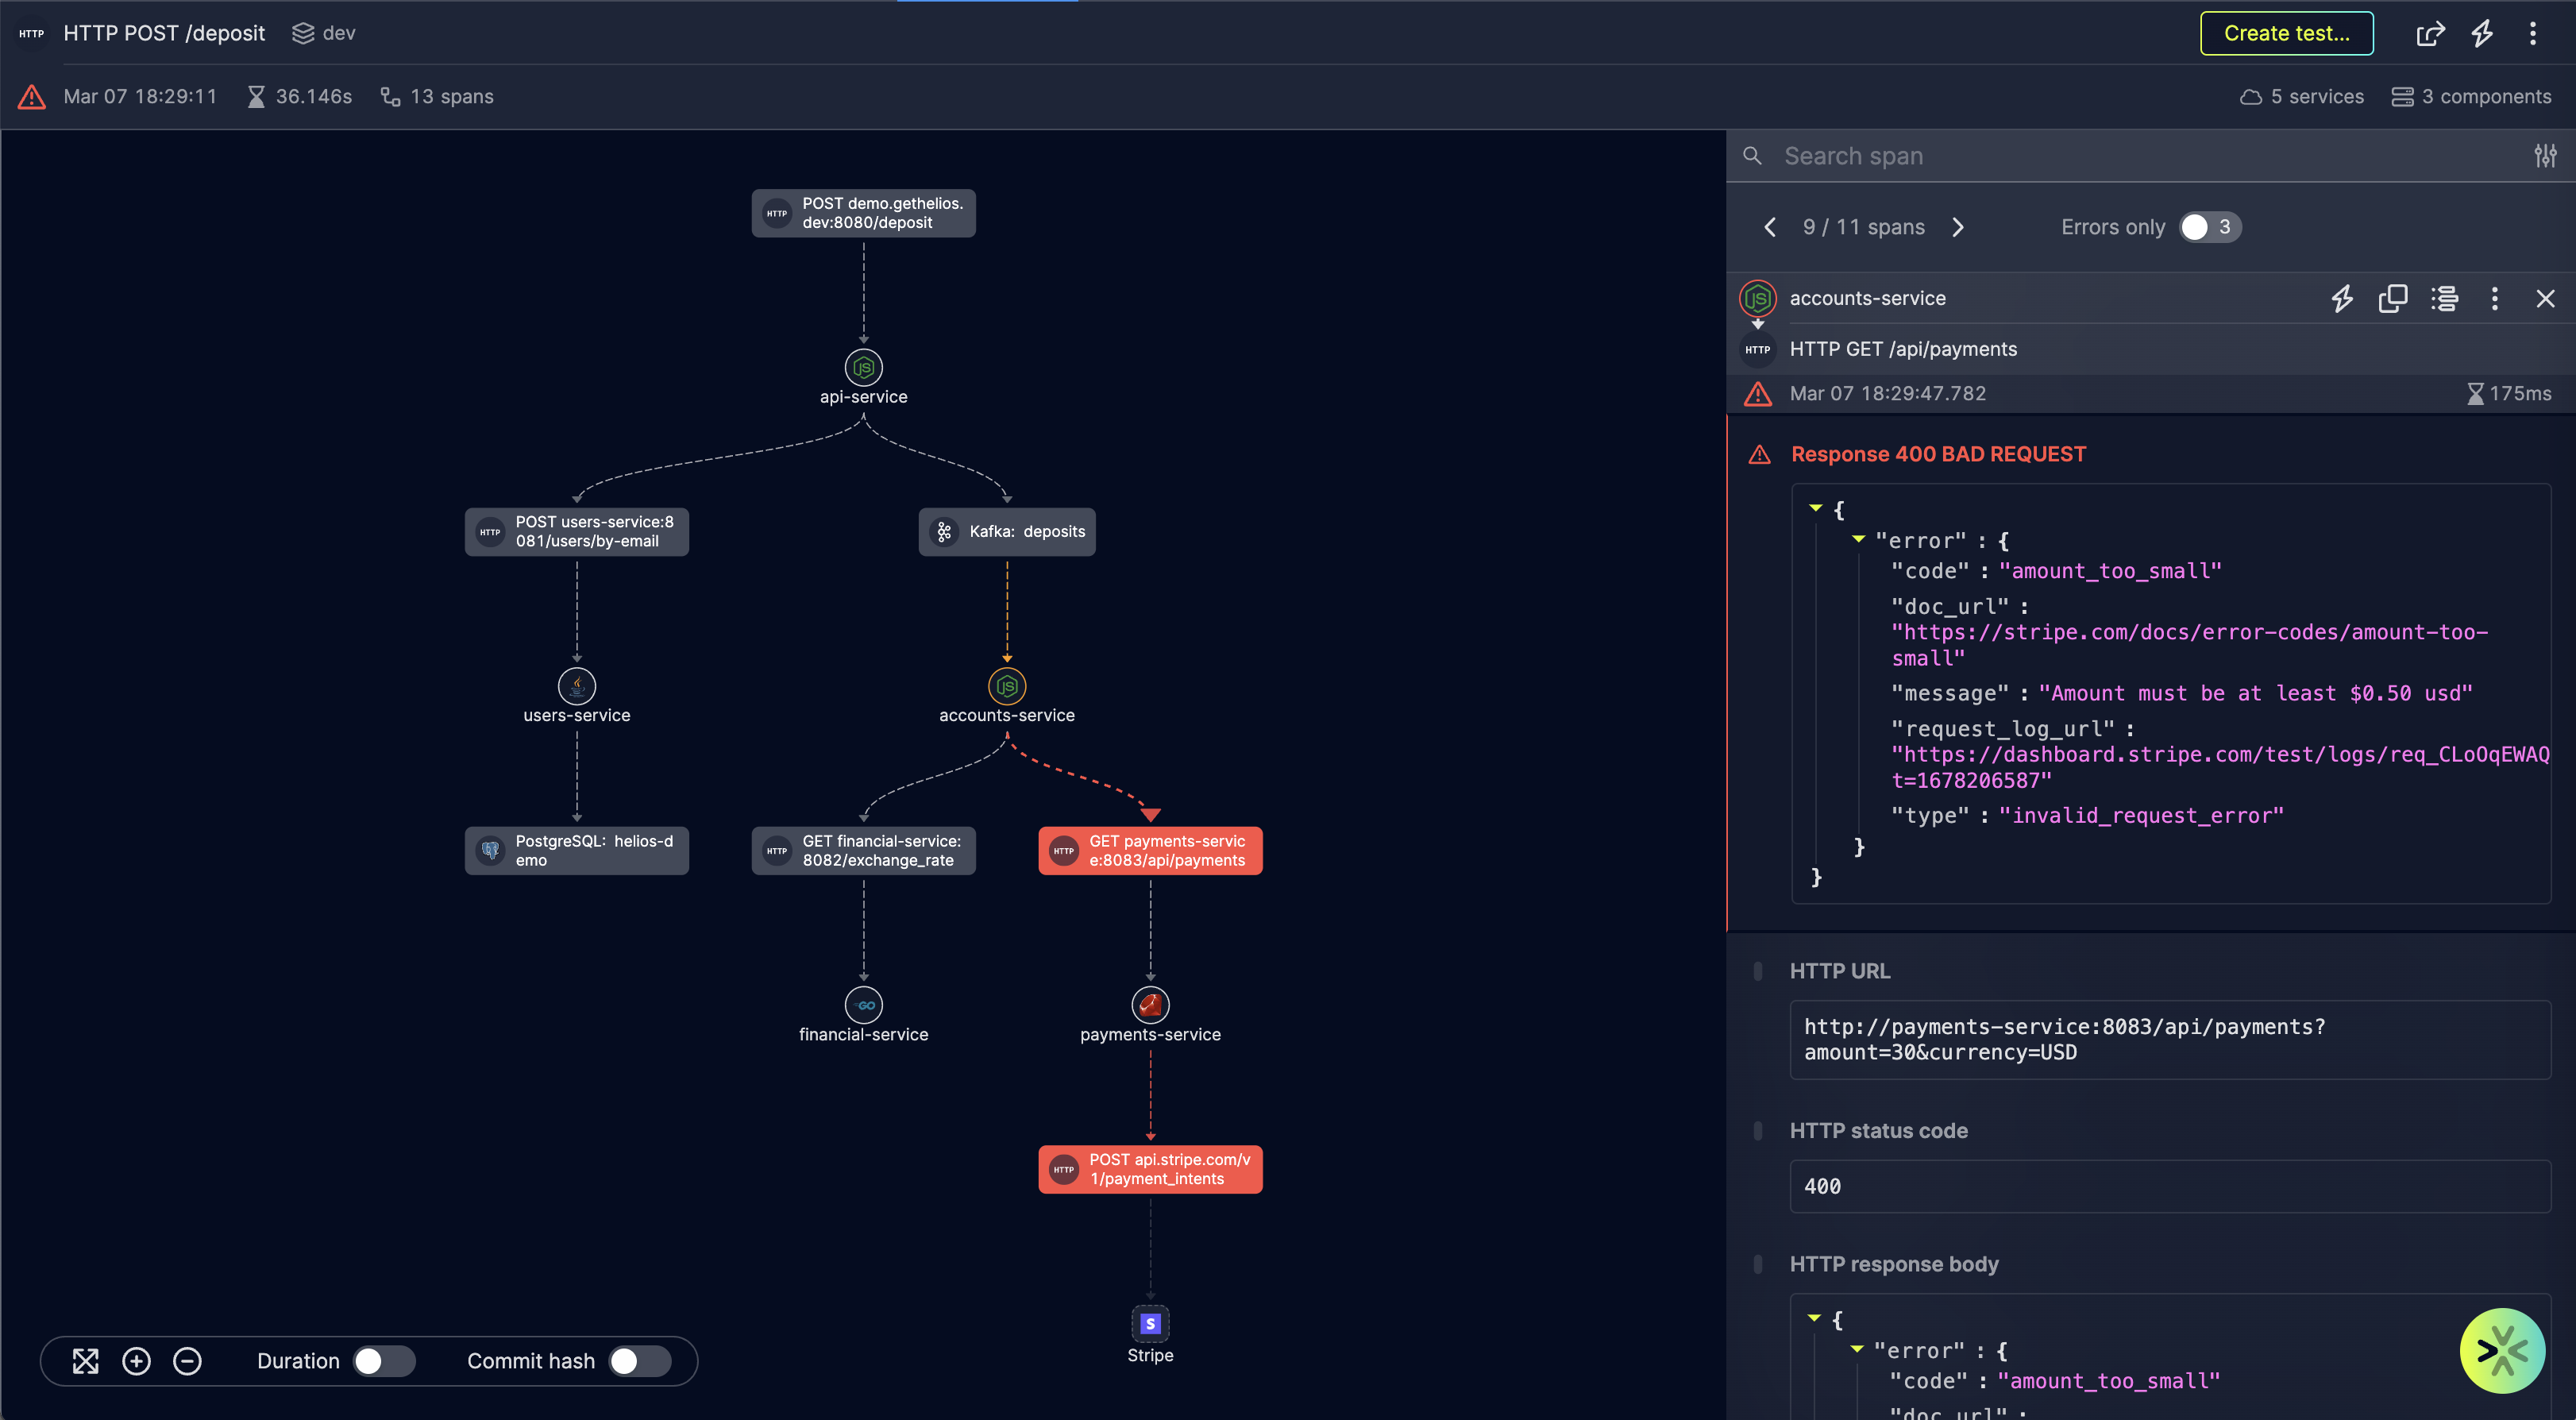
Refers to providing visibility in the form of E2E visualizations of your distributed application. Tracing is one of the core signals of observability, and distributed tracing tools will generally offer an ability to visualize your app flows and understand the dependencies between different components in your application, and set alerts based on various metrics. Observability also includes access to a trace-based service map and API catalog. - Troubleshooting
How easily can you pinpoint and reproduce issues in your system so that you can quickly fix them? Features such as generating the code to trigger a specific flow and editing the trigger configuration on the spot, or accessing the trace of a failed test in your CI directly from the test run itself, can help with troubleshooting and reducing MTTR. - Testing
Refers to the ability to generate E2E test code to validate complex backend flows. You can use distributed tracing tools to validate hard-to-test asynchronous operations and get visibility into test failures. - Collaboration
These are tools that help teams work together easily and quickly, through the sharing of traces, tests, spans, filters, and flow triggers. Collaboration features allow team members to save time when working together on troubleshooting a problem in production or local environments and thus can significantly improve the overall dev experience.
Developer workflow integrations
Distributed tracing tools should offer workflow integration options to meet developers along the entire developer journey lifecycle. To make the most impact, these tools cannot be siloed from where developers live on a regular basis, i.e. whether they’re opening tickets in Jira or communicating on Slack. The idea behind distributed tracing is to provide developers the right data, with the right context, at the right time – integrating with your team’s workflow tools enables that, and improves the developer experience.
Deployment across services, environments and the entire tech stack
Coverage, adoption and expansion are critical for the ultimate success of introducing a distributed tracing tool. By deployment we mean the languages and instrumentations supported to make the distributed tracing deployment process as easy, frictionless, and pain-free as possible. It also includes a wide range of microservices in different languages and components in your tech stack.
- Multi-environment support
Refers to being able to use the distributed tracing tool in the environments where you’re developing and troubleshooting – local, pre-production, CI/CD, and of course, production. The deployment should be flexible so you can install the distributed tracing tool in any environment without needing any code changes. - Language support
In the evaluation criteria, we include several languages that can be supported to provide maximum flexibility for developers. This support gives developers the ability to deploy their distributed tracing solution across their services without having any blind spots to truly achieve E2E coverage – doesn’t matter if the microservices are written in Golang, Node.js, Python, Java, .NET or Erlang. - Collector integration
Some dev teams already have OpenTelemetry (OTel), or use languages that are not supported by specific instrumentations. In this case, support for collector integration enables them to deploy OTel on their own, send it to a collector, and get the instrumentation, providing another form of flexibility that might be important. - Kubernetes (K8s) cluster deployment
Dev teams running their microservices in Kubernetes often expect a centralized way to install the SDK across microservices and environments – by leveraging a Kubernetes operator. - Serverless deployment
For dev teams using of Lambda functions across their architecture, it might be important to be able to install and update the SDK via standard AWS mechanisms such as Lambda layers or a serverless plugin.
Another important element here is avoiding vendor lock-in. One way to mitigate this risk is to always select a vendor that offers the industry standard – OpenTelemetry. This saves the burden of adopting proprietary instrumentation protocols that might hinder any future efforts to switch a distributed tracing vendor.
Lastly, ease of user onboarding and expansion of use across team members is also something to consider.
Privacy & security of instrumented application data
The goal of privacy and security features is to lower the risks you’re introducing into an organization via a distributed tracing solution. We include these in the evaluation criteria as a measure of reliability. We emphasize the different layers of data security & privacy needed for different teams depending on their company policy and business needs. For example, some distributed tracing tools allow you to collect payload data (HTTP request and response bodies, message queues content, and DB queries and results). Payload data can help enhance other capabilities and allows developers to understand how flows progress through a distributed application much faster and more intuitively. However, some teams may need to be able to choose which payloads are collected to comply with data privacy policies; or they need to be able to obfuscate sensitive data, or even default to metadata-only collection if they so choose.
Granular controls ensure each team can leverage the breadth and depth of a distributed tracing solution to achieve its business and service goals – without compromising business policies compliance.
Support model
Buying a service from a vendor is similar to forming a partnership with the vendor. The support model you choose has to fit your needs, and it’s the same in distributed tracing solutions. Support options will vary by channel and SLA. From a developer perspective, the support options provided are ultimately what you commit to when delivering for your users.
Pricing
We believe usage-based pricing (UBP), vs. seat-based and feature-gating, should come standard in distributed tracing tools. This is to help keep the pricing model simple and, more importantly, align the value captured by the user with the value captured by the vendor. With UBP, customers can start using a product at a relatively low cost, and grow usage as they get more value out of the tool – with a clear line of sight on its cost impact.
Conclusion
As the distributed tracing solutions market grows, understanding the strengths and weaknesses of each solution can help you choose the one that is right for you. Different solutions will have different capabilities that can make all the difference in terms of security, pricing, the developer experience, etc. We attempted to capture these capabilities and other criteria in our distributed tracing evaluation framework and are happy to share it with the broader community.
While the framework helps audiences understand how to think about distributed tracing tools, we hope developers also use it to help them figure out which capabilities they need in order to solve problems in the developer journey. Devs should use the framework as a practical tool to help them weigh what’s important for them and their teams, and to help them make smart decisions on what solutions best fit their situation.
Lastly, this spreadsheet is a living, breathing framework that is constantly being updated based on market trends, and customer needs and feedback. What capabilities are important for you in a distributed tracing tool? What would you add to the framework? Drop me a note at maya@gethelios.dev.


