

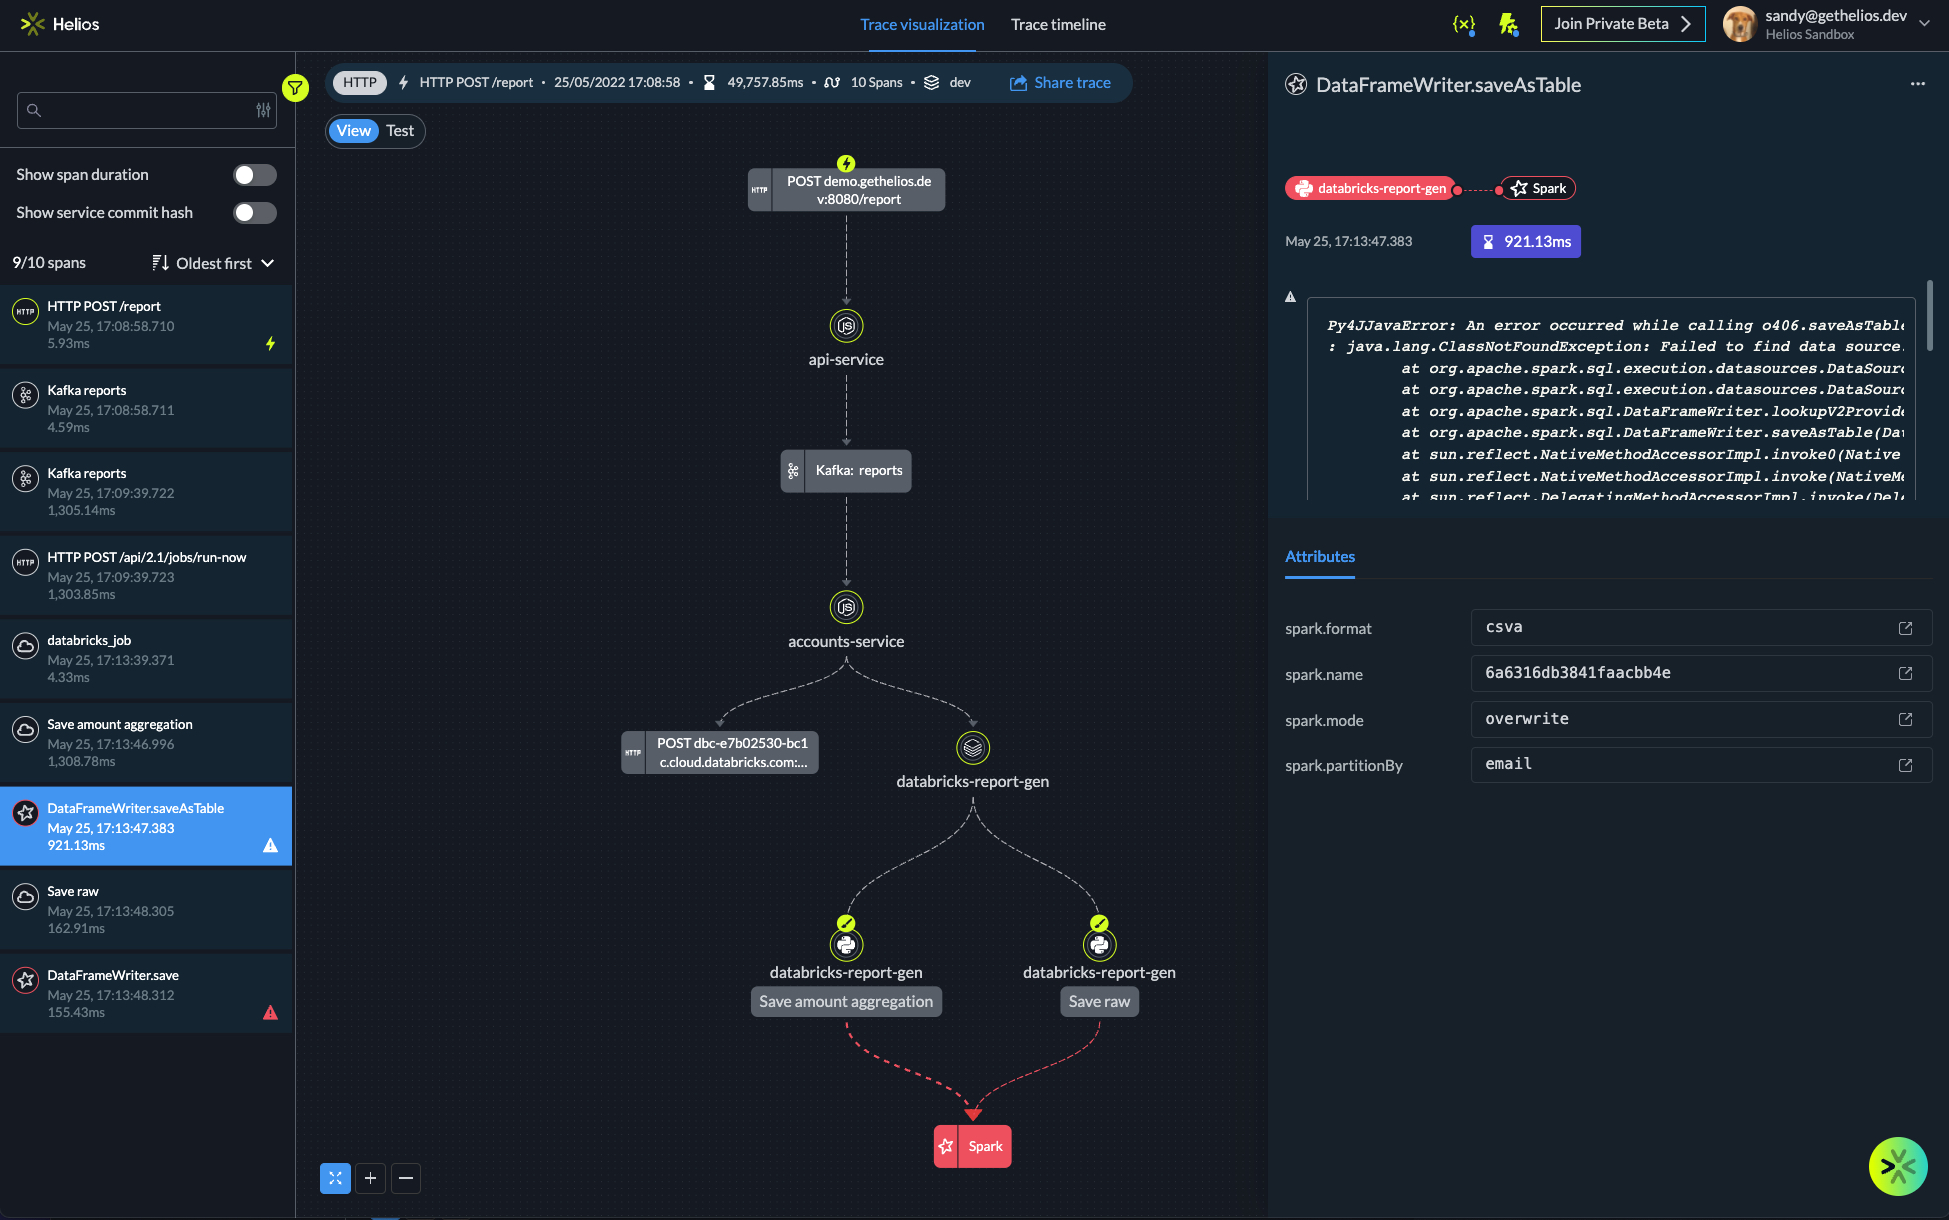
Data pipelines like the Databricks pipeline may be one of the most crucial places where your code runs, but the visibility you’re getting there is limited. With Helios you can see downstream how services interact with each other and the connections between them.
In distributed application environments, to solve problems in code you need to be able to connect the dots between all the different places where your code runs, including data pipelines in data frameworks like Databricks and Apache Airflow. The Databricks pipeline may be one of the most crucial places where your code runs, but the visibility you’re getting there is limited. Usually the pipeline is detached from the rest of your architecture – which makes it nearly impossible to test, monitor and understand how your code is executed. Databricks notebooks are often triggered by microservices, which also consume their output, but all those components are siloed.
You can get insight into your end-to-end flows by adapting OpenTelemetry’s (OTel) context propagation method to fit the specific mechanism of triggering and running Databricks notebooks. OTel is the emerging standard for instrumenting, generating, collecting, and exporting distributed tracing telemetry for analysis and software performance monitoring. Helios leverages OTel to enable you to see a flow propagating through the components of your application – including microservices and notebooks, how they are connected, and what is triggering and is triggered by the notebook.
With Helios you can:
- See downstream how services interact with each other and the connections between them
- See how data flows through your entire application with interactive trace visualization
- Understand issues and where they occur, and easily resolve them before deploying to any environment
- Generate tests across the end-to-end flow, including your Databricks notebooks
Click to learn more on how to trace your data pipelines with Helios.
Databricks – A data pipeline use case
Let’s look at an example. A daily scheduled job pulls data from a database, pushes it into a few Kafka streams, and then triggers a Databricks Job which works on top of these streams to produce a certain result. This type of flow is not necessarily easy to monitor and track. The participating components are deployed apart from each other and the only means of interaction between them is through APIs and messaging systems (Kafka in this case).
OTel enables you to trace this type of flow by adding the context of the current run to all of the data which runs through the different components. We use OTel to enable you to track these types of complex jobs out-of-the-box upon installing Helios in your stack. Helios provides visibility into the data on the flows, allows you to troubleshoot issues, and enables you to build tests on top of the flows.
Getting the full picture
Data pipelines are usually siloed from your applicative flows in distributed systems. However, though the data pipelines may be detached in your architecture, you need visibility into frameworks like Databricks to test, monitor and understand how the entire flow comes together. With Helios you can see how a trace propagates through all the components of your application, including notebooks, giving you full visibility into how these components work together and enabling you to take actions based on those insights.


