


OpenTelemetry (OTel in short) is an open-source observability framework that provides a standard set of vendor-agonistic SDKs, APIs, and tools to connect with observability backends. It supports all major programming languages, including Java, Python, Node.js, and Go.
In short, it lets you collect, export, and analyze telemetry data from your applications and services, including metrics, traces, and logs. Metrics are measurements of your application’s performance, such as CPU usage, memory usage, and response time. Traces are records of how your application’s requests are handled, including which services are called and how long each call takes. Logs are text messages that your application generates, such as error messages and informational messages.
It is gaining popularity as it allows solving observability and troubleshooting challenges in microservices environments through distributed tracing.
However, integrating OTel with Golang is particularly challenging due to several reasons.
In this article, you will learn about the challenges of OpenTelemetry Golang, installing OTel Go, and how a new approach for compile-time auto-instrumentation makes the process of adding traces to Golang apps much easier with much less friction.
This article is brought by Helios – allowing developers to install OTel-based tracing with visualization and change the way they observe, debug and test microservices in less than 5 minutes. You can start using it for free.
The challenge with Go OpenTelemetry
Golang distributed tracing based on OpenTelemetry is specifically challenging. With dynamic languages (e.g. Python or Node.js), we can replace the implementation of a function at runtime using techniques like monkey patching. For languages like Java with intermediate language, it’s possible to manipulate the bytecode using the Java Agent mechanism to support instrumentation.
However, Go’s strong typing and compiling into machine code makes it difficult to perform the instrumentation dynamically; making runtime changes to compiled machine code is risky and it may be considered a security problem.
How is Golang tracing done today?
Let’s look at the classical way of integrating OTel distributed tracing with Go
Golang tracing – Step 1
First, install the OTel Go library using the below command:
go get go.opentelemetry.io/otel
Step 2 – Import OpenTelemtry Go library
Next, import the OTel Go library and use the otel.Tracer() function to create a tracer and the Start() function to start a new trace span:
import (
“context”
“go.opentelemetry.io/otel”
“go.opentelemetry.io/otel/api/trace”
)
func main() {
// Create a new trace context
tracer := otel.Tracer(“my-service”)
// Creating a new Span
ctx := context.Background()
_, span := tracer.Start(ctx, “main”)
defer span.End()
Step 3 – Add attributes and events to the span
Then, add attributes and events to the span. You can use the AddEvent() function to record log events, and the SetAttributes() function to add span attributes.
// Record a log event
span.AddEvent(“some work”)
// Record an attribute
span.SetAttributes(trace.StringAttribute(“key”, “value”))
However, real-world scenarios will require more configuration than the above. For example, the below code snippet is from the OpenTelemetry-Go GitHub repository. It shows the number of configurations you need to instrument a simple HTTP call.
client := http.Client{Transport: otelhttp.NewTransport(http.DefaultTransport)}
As you can see, it requires you to make changes to every HTTP call in order to configure the client’s transport and to instrument the native net/http module. The same goes for server-side net/http, which also requires adding code to every HTTP handler, as can be seen here. This requires making code changes to dozens of files and isn’t maintainable.
Simplifying OpenTelemetry Go instrumentation
But there’s another way. Let’s look at a unique approach to provide a safer, maintainable, and more understandable way to implement OTel tracing in Golang.
Unlike in dynamic languages, when it comes to Golang, this approach focuses on integrating OTel at compilation time.
It uses a combination of AST (Abstract Syntax Tree) manipulations and proxy libraries.
- AST manipulation – Helios utilizes Go’s AST to parse the source code and replace necessary libraries with its telemetry-enabled proxy library counterparts.
- Proxy libraries – Wraps the original libraries with instrumentation code, keeping the external API the same.
To better understand, let’s consider a Go observability example of making an HTTP request.
Step 1 – Creating a proxy library
The classical instrumenting approach requires developers to wrap the http.Handler using the manual otelhttp module with OTel. We resolve this issue by creating an open-source proxy library identical to the original one that exposes the same function signature with OTel support.
The below example shows a part of the proxy library created to handle HTTP requests. This proxy library replaces the need of adding the Otel handler for each endpoint – and so defining the HTTP handler remains the same.
package helioshttp
import (
“bufio”
“context”
“io”
“io/fs”
“net”
realHttp “net/http”
“net/url”
“time”
“go.opentelemetry.io/contrib/instrumentation/net/http/otelhttp”
)
…
func Handle(pattern string, handler Handler) {
handler = otelhttp.NewHandler(handler, pattern)
realHttp.Handle(pattern, handler)
}
Step 2 – Replacing imports
We provide a compile-time instrumentor, capable of replacing the ‘imports’ of the original library with its proxy counterpart. It will also update the go.mod file by adding the proxy library (and making sure it’s up to date). The example below will show you how the imports are updated (Actually, this happens at the AST level):
# Default import
import (
net/http
)
# Replaced import of instrumented library
import (
http “github.com/helios/go-sdk/proxy-libs/helioshttp”
)
As you can see, this is a pretty simple process to implement OTel based tracing in Go, automatically replacing the files import statements. So, let’s discuss the advantages of this Golang – OpenTelemetry approach compared to classical Go OTel instrumentation.
If you are ready to dip your feet in the water, move to Implement distributed tracing and observability over microservices in Go – docs guidelines
Advantages of the Go OTel-based approach
1. Platform agnostic
Unlike other potential approaches, Helios OTel integration is not tightly coupled with the platform since it is added at the code level in compile time. You can use this with any combination of operating systems and system architectures that Go supports.
It also avoids platform-related issues like handling different CPU architectures since the ‘imports’ are replaced at the AST level instead of the machine code level.
2. Reducing friction
Helios provides transparency for developers to see what the instrumentation does. Since the proxy library code is open-source, you can also go through it and understand how it works.
For example, classical OTel net/http proxy configuration requires manual wrap each HTTP endpoint with an OpenTelemetry wrapper handler like the below:
import (
“net/http”
)
helloHandler := func(w http.ResponseWriter, req *http.Request) {
ctx := req.Context()
span := trace.SpanFromContext(ctx)
bag := baggage.FromContext(ctx)
span.AddEvent(“handling this…”,
trace.WithAttributes(uk.String(bag.Member(“username”).Value())))
, = io.WriteString(w, “Hello, world!\n”)
}
otelHandler := otelhttp.NewHandler(http.HandlerFunc(helloHandler), “Hello”)
http.Handle(“/hello”, otelHandler)
err = http.ListenAndServe(“:7777”, nil)
However, if you use Helios, you do not need to worry about this since the Helios proxy library automatically wraps each http.Handle call. After the import replacement is made, developers can click on the “Handle” function and find the instrumented implementation. This is even an advantage in comparison to instrumentation implementations in languages like Node or Java, where it’s quite hard for developers to know what actually happened under the hood.
import (
http “github.com/helios/go-sdk/proxy-libs/helioshttp”
)
…
helloHandler := func(w http.ResponseWriter, req *http.Request) {
ctx := req.Context()
span := trace.SpanFromContext(ctx)
bag := baggage.FromContext(ctx)
span.AddEvent(“handling this…”,
trace.WithAttributes(uk.String(bag.Member(“username”).Value())))
, = io.WriteString(w, “Hello, world!\n”)
}
http.Handle(“/hello”, helloHandler)
err = http.ListenAndServe(“:7777”, nil)
Advanced tools that support this instrumentation approach and add visualization
Helios has its own set of internal tools to generate proxy libraries. These tools take care of most of the library generation and maintenance work.
Proxy library generator
When a proxy library is generated, we need to ensure that all the exported members in the original library are available in the newly created proxy library. Sometimes, there can be hundreds of functions and variable declarations to create, which is obviously time consuming and error prone.
Helios has its generator for this process, which automatically generates the boilerplate for the proxy library based on the original library. So, creators of a new proxy library only have to implement business logic, and there is no risk of missing out on functions or variable declarations.
Here is an example of an original library and its corresponding proxy library generated by the Helios proxy library generator.
// Original Library
package test_package
import (
“context”
)
type ExportedType = string
var ExportedVar = 1234
const ExportedConst = “abcd”
func ExportedFunc() {
}
// Helios Generated library
package heliostest_package
import (
origin_test_package “test_package”
)
type ExportedType = origin_test_package.ExportedType
var ExportedVar = origin_test_package.ExportedVar
const ExportedConst = origin_test_package.ExportedConst
func ExportedFunc() {
origin_test_package.ExportedFunc()
}
Library interface validator
This validator ensures that the interface of the proxy library matches the original library. It is a crucial step in generating a proxy library since it helps developers check if a new version of the original library is available and what interface changes they need to make in the proxy library.
Tagging of versions
Helios maintains a version tagging technique to maintain the connection between specific versions of the original libraries and the proxy libraries. It ensures that proxy libraries have correct imports at the compile time.
Conclusion
Golang OTel integration is challenging compared to other programming languages like Python, Java, and JavaScript. It requires manual effort and is often time-consuming. Hence, it is essential to look beyond classical instrumentation approaches with Go.
Helios addresses most of the classical challenges when integrating OTel with Golang. In addition, its observability backend solution seamlessly integrates with OTel accelerating the troubleshooting and development process with actionable data and contextual visualization
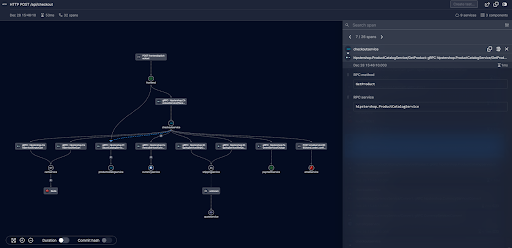
The following example shows a trace visualization generated by Helios for a Go service. You can find the complete visualization on the Helios OpenTelemetry Sandbox.
You can sign up with Helios free tier from here to try it out.
Related: How to adopt distributed tracing without compromising data privacy


