


Getting our on-call alerts with the complete context covering all observability pillars – traces, metrics, and logs – is a game changer when troubleshooting production issues in distributed apps.
On-call shifts are part of every developer’s job – we’ve all been there. It’s 3am, suddenly you get an alert for an issue occurring in production. The microservices landscape is complicated and finding the root cause of an issue is like looking for a needle in a haystack. How can you get to the root of what’s happening in the system so you can analyze and resolve the issue quickly and effectively?
You need the right tools that will help you investigate the issue, self-sufficiently, without needing to bother other developers on your team – not to mention managing your own burnout. I, and others at Helios, have written extensively on how distributed tracing can help developers solve app errors and accelerate Mean Time To Repair (MTTR), with the right context provided by OpenTelemetry-based traces.
To streamline the process even more, we’ve started using trace-based alerts. This allows us to get notifications with detailed insights into our own application encompassing all observability pillars – traces, metrics, and logs. With this information, we can get a clear picture of the performance and health of our actual Helios app to make sure it is up and running and serving our customers well.
Using trace-based alerts, we can define what search queries are interesting to track for business or engineering purposes. Each alert can be reported as a notification through popular apps such as Slack or PagerDuty. The key is that each notification includes an example for a matching trace for which the alert rules were met. This dramatically improves the overall developer experience, as the full E2E context is made available right there in the notification.
Below I walk through a few examples of how I used trace-based alerts to increase my productivity – to proactively identify bottlenecks, anomalies, and potential issues in the system, and how I resolved them, before they escalated to something bigger.
Those examples include:
- Investigating erroneous operations in production
- Monitoring failing E2E flows in production
- Inspecting long Elasticsearch queries
Use case 1: Investigating erroneous operations in production
Let’s start with a rather straightforward alert definition – this is the ‘with operation errors‘ search criteria in Helios, which filters all traces that include some kind of erroneous operation.
By defining an alert based on this search criteria, we expect to be notified on every error in the system, with the relevant trace for which the error occurred. We actually do utilize this kind of alert definition within our team at Helios, for certain services where we know we want this kind of resolution on raised errors.
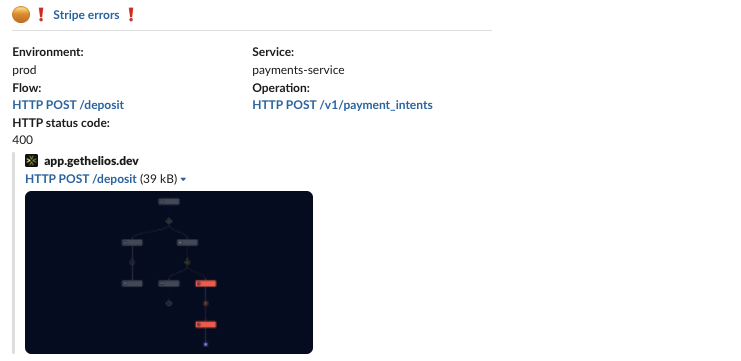
Here’s an example of an error we recently encountered within our application. This is what shows up in the error message from Airbrake:
x_content_parse_exception: [x_content_parse_exception] Reason: [1:315] [bool] failed to parse field [filter]
So somewhere in the system we encountered a parsing exception. But where? and why? Here’s what our logs look like for such an error:
{
"error":
"reason": "[1:266] [bool] failed to parse field [filter]",
"caused_by": {
"reason": "field name is null or empty",
"type": "illegal_argument_exception"
},
"type": "x_content_parse_exception",
"root_cause": [
{
"reason": "[1:266] [bool] failed to parse field [filter]",
"type": "x_content_parse_exception"
}
]
},
"status": 400
}
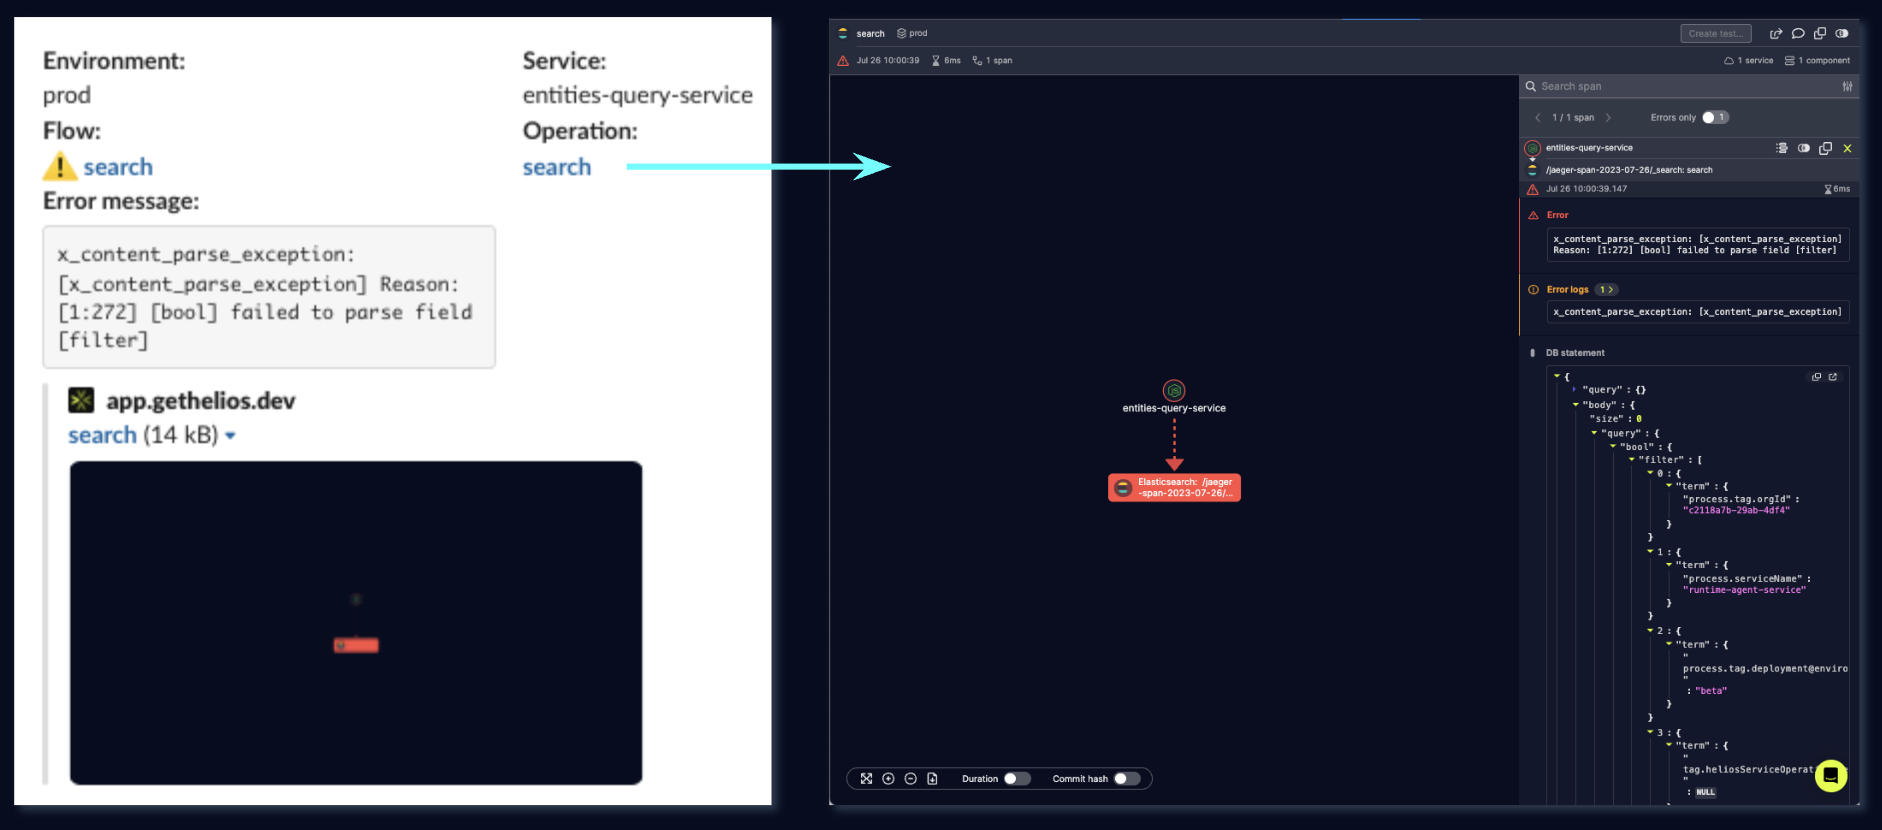
This looks like some error response we got back for some kind of HTTP request. Further digging in logs will show this is the response for an Elasticsearch query, but still makes it hard to understand the root cause of the error – we don’t see the actual query, and we’re also missing the context, or the reason, for this query being executed.
On the other hand, here’s what the alert from Helios looked like:
Same error message, granted, but this time, as opposed to just having an error log, we have a trace link on our hands, with important context readily available. This helps us get to the root cause of the issue within literally seconds – just click the link to the erroneous trace, and voila!
Here we have it – an HTTP query, to Elasticsearch, with the actual query attached. At this point we can easily deduce the parsing exception – we accidentally pass a NULL value as one of the filters. Refining the logic around this query quickly solved the issue.
Use case 2: Monitoring failing E2E flows in production
Let’s take this a step further.
While having an alert fired for each and every error in the system can be a good thing, it can also become quite noisy very quickly. Of course, you can always refine your alert definition to match only specific services, or types of operations (HTTP invocations, database queries, etc.), but there’s still more to gain by having trace-based alerts.
Have a look at this trace, for example:
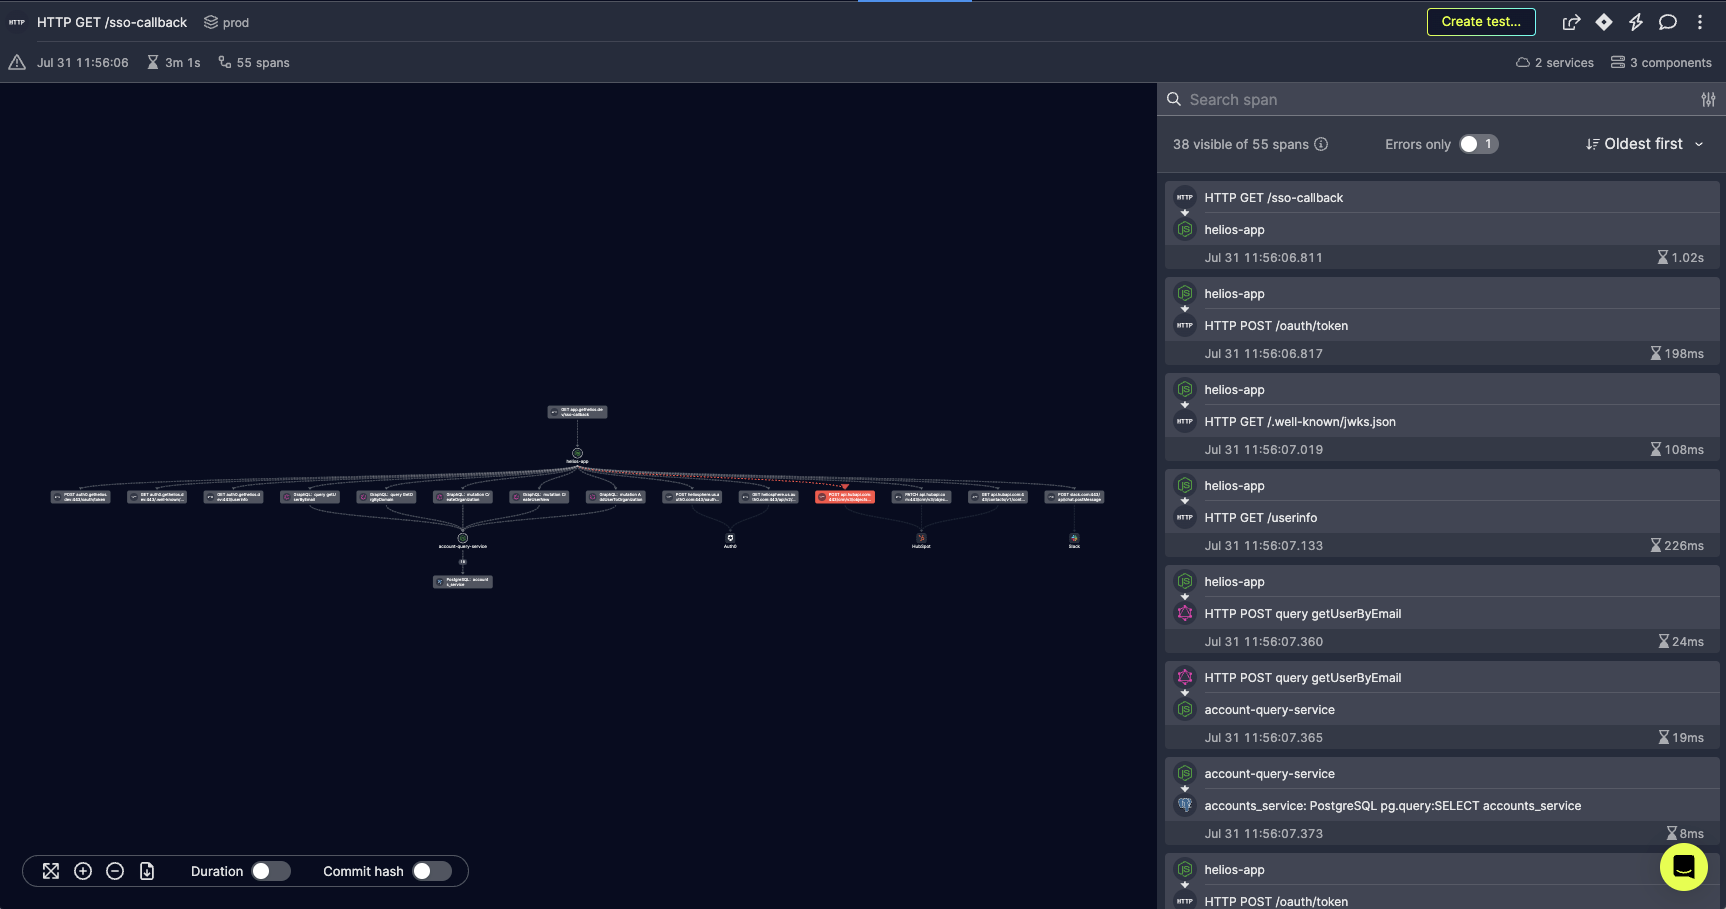
This is another trace from our application, which includes an erroneous operation. With the previous alert definition, such a trace would trigger an alert.
But since we have the bigger picture available by having the entire trace, and not just the actual erroneous operation (span) within it, we have a better understanding of what’s going on.
Notice the root of the trace. This trace shows the user creation flow – an HTTP operation which triggered some underlying requests, one of which resulted in an error (trying to create an already-existing user in Hubspot). Nevertheless, the enclosing HTTP operation shown by the root span, ended successfully and reported back a successful HTTP response.
Having the full context available to us in this case is priceless, it helps us understand this operation error is not necessarily a problem – and definitely not a high-severity alert to investigate urgently – since the user, or the client application that invokes it and gets back the response isn’t affected by it.
Providing this context for trace-based alerts, Helios lets you define a search criteria that targets the root span of the trace. We can use this criteria on top of our previous erroneous alert definition. You can immediately see the difference – in the trace below it’s also an HTTP operation being triggered, but this time it encounters a significant error along the way, and hence ends up reporting back an error response, which indicates the whole operation results in failure, essentially.
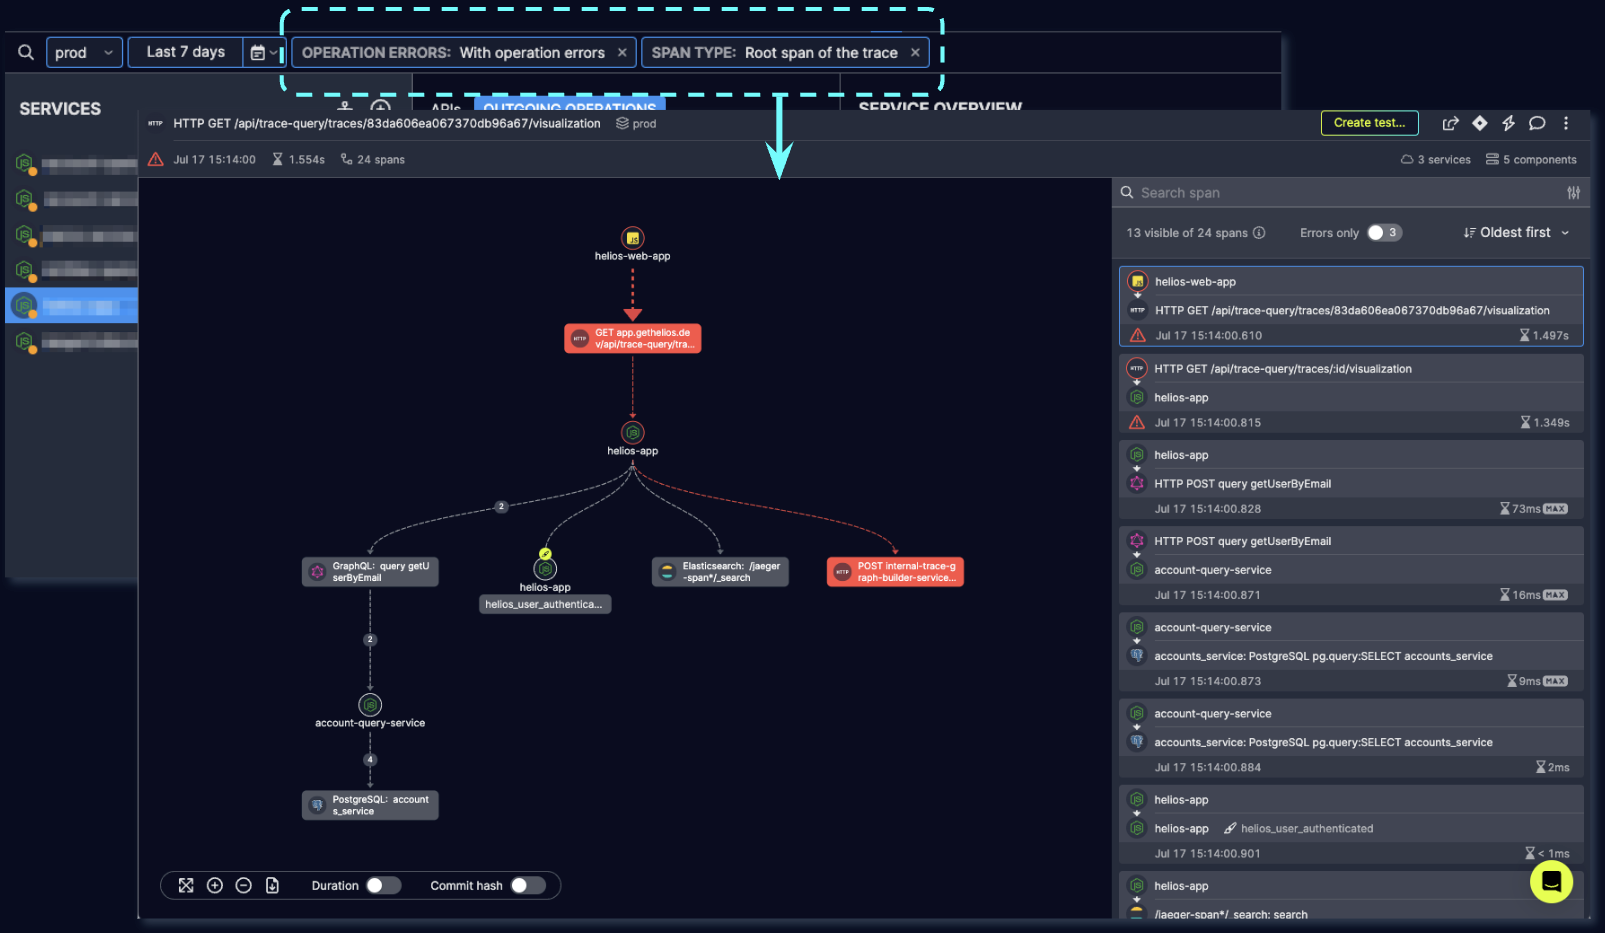
Looking into the underlying error this time, it is a temporal networking issue that prevents the calling service from successfully handling the request.
Being able to easily differentiate traces like these two we have mentioned above, massively helps in triaging and being able to focus on the most critical errors, and then getting to the root cause quickly and effectively.
Use case 3: Inspecting long Elasticsearch queries
Let’s keep this line of thought in the realm of networking issues. We went through using trace-based alerts for alerting on two kinds of errors, but we don’t necessarily want to wait for an error to occur in order to be alerted for something. After all, having good observability into the “bigger picture” as we’ve already seen, can help identify issues based on a trending behavior, and before they materialize into actual errors (and ruin your weekend…).
In addition to being able to define a search criteria and a matching alert on span attributes like errors and payloads, Helios lets you search for spans based on some key metrics, also based on OpenTelemetry instrumentation.
Take span duration, for example. The duration of a span in a trace stands for the time it takes for the recorded operation to complete. If we go back to our example of the HTTP root span from the previous trace, this span operation is only completed when the response is returned to the user, and hence the span duration represents the time it took to handle the request.
This brings us to our next alert definition, which can be set in Helios with the following criteria: Span duration > 10 seconds along with root span of the trace. This search criteria should lead us to potentially slow operations invoked in our system.
Here’s a trace that showed up when we started monitoring our own application using this label:
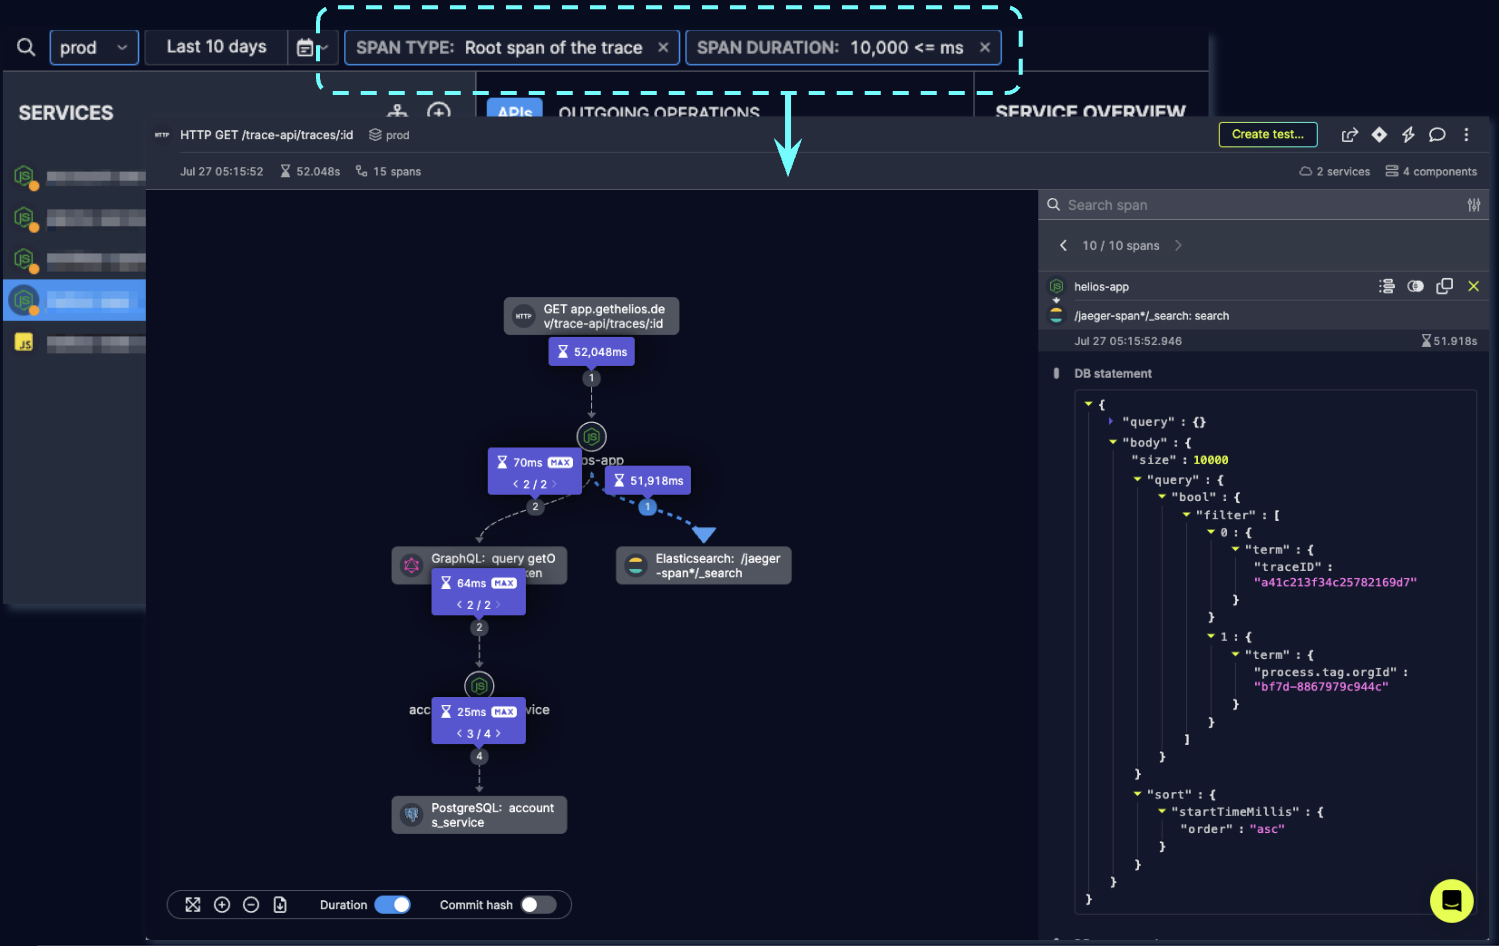
It shows an API call that took almost an entire minute to complete. But why? let’s have a look – we have everything we need, don’t we?
The trace shows two underlying invocations as part of handling this API request – one to a GraphQL server, and one to Elasticsearch. The duration of each of these underlying spans can easily be visualized in Helios by enabling the Duration toggle on the trace. This immediately shows us the Elasticsearch operation is the culprit in this case. Let’s have a look at this span and see what the request payload consisted of.
Looks like a rather straightforward query – we search for a trace in our system, using its ID, which is indexed and should be quickly retrievable for a query. So if the query looks ok, what could be the issue? Remember we’re not looking at an error here, since this trace is perfectly OK except for the long duration which implies something is off.
We then decided to look for other Elasticsearch queries in and around this time range in Helios, and could immediately see the spike in Elasticsearch operations.
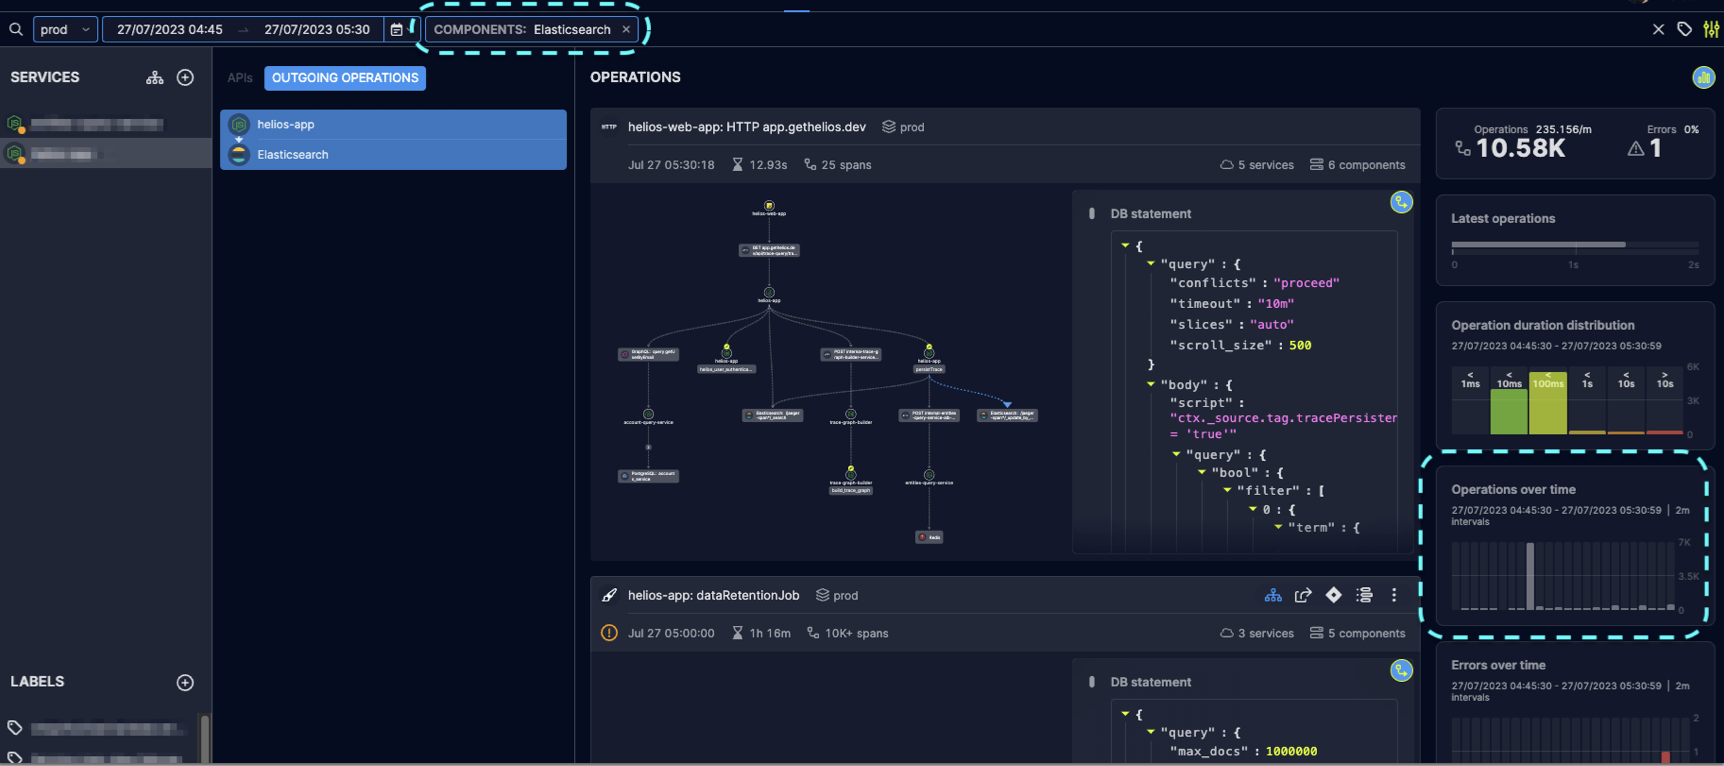
Turns out, this is the time of day where we clean up old data, which puts Elasticsearch under load and slows our whole application down. We’ve since changed this logic in order to reduce the stress on the system and spread it over a longer time range.
Knowing what we know now, we can go ahead and suggest a solution for this, before we reach a scenario where queries completely time-out and return an error response.
Once again, having the context available at hand – this time it’s the “bigger picture” context, available by having other traces recorded in and around our trace-based alert – we were able to get to the root cause of our issue in a very short time and with minimal effort.
Leveraging trace-based alerts to reduce MTTR and increase developer productivity
I used the examples above to demonstrate how incorporating trace-based alerts into the ongoing observability & monitoring practices of distributed applications can make a significant impact on developer productivity – and ultimately also on customer satisfaction. Whether it’s investigating erroneous operations, monitoring failed E2E flows, or inspecting long duration calls, having the full context at my fingertips dramatically reduces the time I spend troubleshooting production issues, whether during on-call shifts or when I roll out a new feature. It’s also a positive factor in managing developer burnout and increasing overall productivity. I hope that you understand now how to leverage trace-based alerts across your own microservices, and hopefully make this experience a bit less painful.


