

OpenTelemetry (OTel), is an open source, CNCF (Cloud Native Computing Foundation) project that provides tools, APIs and SDKs for observability data collection (i.e, logs, metrics and traces) from cloud-native applications. Developers can use the data collected from OTel to monitor and analyze application health and performance. To leverage the data and its insights, you can export the data to external solutions, like APMs, open source Jaeger and Zipkin, Helios, and others.
In this article, we’ll look at two of these solutions, compare them and see how they can be used together for troubleshooting your microservices applications.
Jaeger VS OpenTelemetry
What is Jaeger Tracing?
Jaeger is an open-source distributed tracing solution that’s become a go-to backend solution for OpenTelemetry. Originally, it deployed an agent on every host, aggregated the data locally, and sent it to a collector component to be stored in a database. Today, it is part of the OpenTelemetry ecosystem and can receive data from OTel (either directly from the client-side or through the collector). Users can query the data and view the results in the Jaeger UI. Jaeger was created by Uber in 2015 and is now a graduated CNCF project.
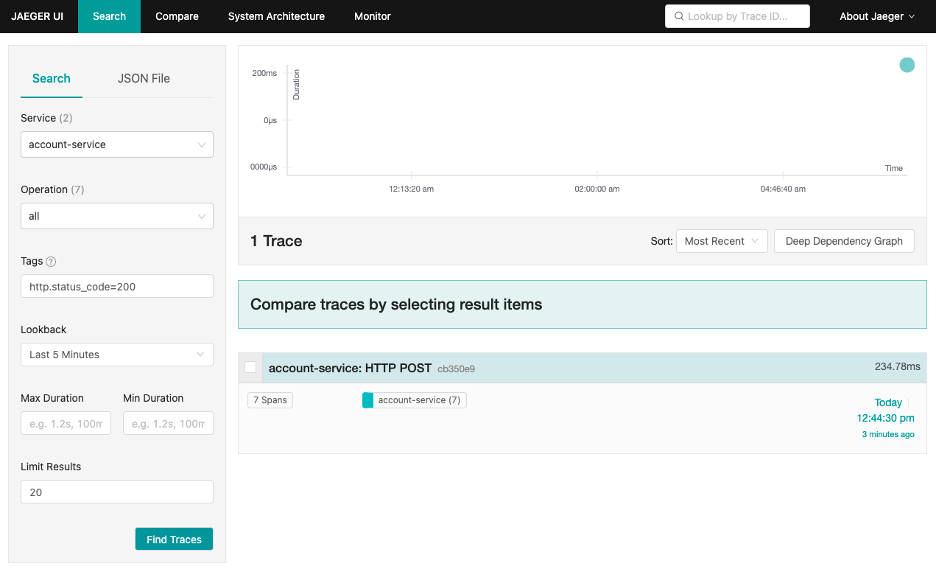
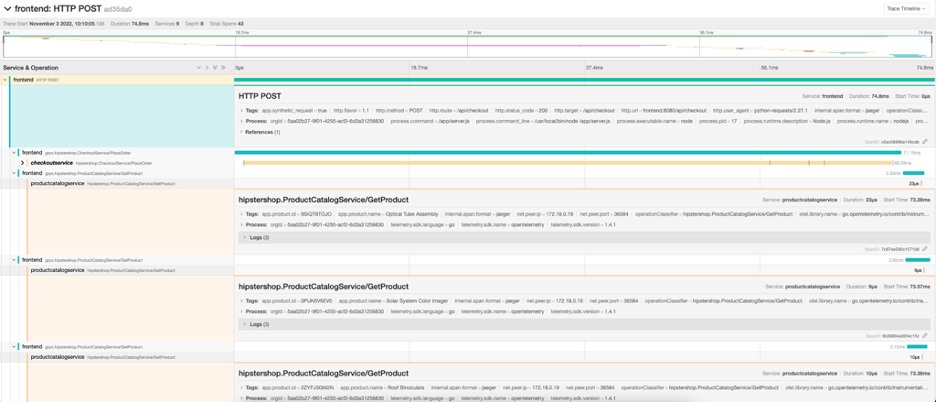
The Jaeger UI
Jaeger Tracing Capabilities
As can be seen in the screenshot above, Jaeger UI provides basic search and filtering capabilities – it’s possible to filter for spans by their service, operations, attributes (based on OpenTelemetry’s semantic conventions), timeframe, and duration. For each trace, it provides a timeline view, similar to the ones provided by virtually any observability product:
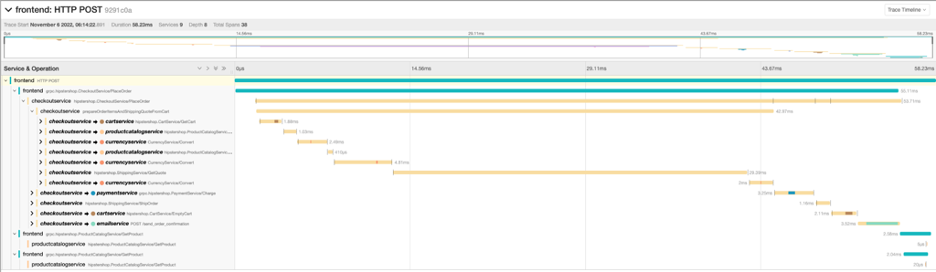
It’s also possible to get a basic trace graph view:
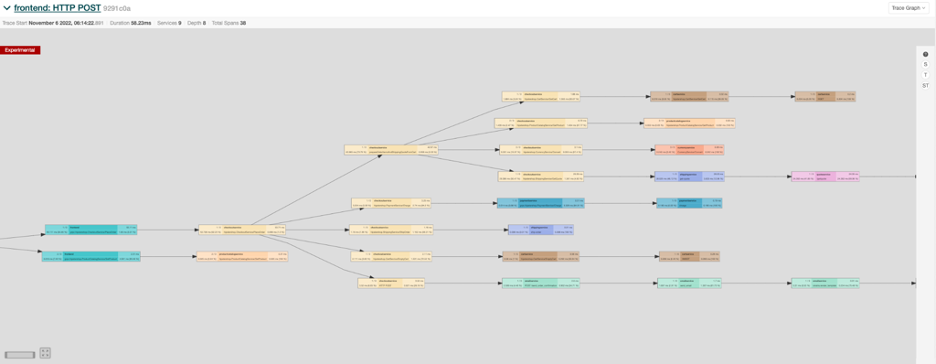
Other views include a span list, trace statistics and a raw JSON mode. Additional advanced features include a trace comparison view and a system architecture view.
Jaeger OpenTelemetry: Getting Started with Jaeger and OpenTelemetery
The easiest way to get started with Jaeger tracing and get a taste of its capabilities is by using its all-in-one Docker image – which was built exactly for this purpose. The Docker image combines all of these components:
- Jaeger Collector – The collector receives traces from the OpenTelemetry SDK (in the past, Jaeger had its own client, but it was deprecated in favor of OpenTelemetry’s) and runs them through a processing pipeline. The collector validates the traces, indexes them, and stores them in either Elasticsearch, Cassandra or Kafka.
- Jaeger Query – The query retrieves traces from storage and hosts a UI to display them.
- Jaeger UI – A web application that fetches data from Jaeger Query and provides search and visibility capabilities (more on that below).
To run the container locally, simply call:
docker run -d --name jaeger -e COLLECTOR_ZIPKIN_HOST_PORT=:9411 -p 5775:5775/udp -p 6831:6831/udp -p 6832:6832/udp -p 5778:5778 -p 16686:16686 -p 14250:14250 -p 14268:14268 -p 14269:14269 -p 9411:9411 jaegertracing/all-in-one:1.38
Then, open the Jaeger UI with http://localhost:16686.
You can start sending traces to Jaeger from an OpenTelemetry SDK using two ways:
1. Report data directly to the collector – in this case, you’re “skipping” the OTEL collector and sending the traces directly to Jaeger. To do that, configure your tracer provider to export data in the Jaeger format. In Node.js, for example, it’s done this way:
import { JaegerExporter } from '@opentelemetry/exporter-jaeger';

const exporter = new JaegerExporter({ host: ‘localhost’, port: 6831 });

tracer.addSpanProcessor(new BatchSpanProcessor(exporter));
2. Export data from the OTEL collector – assuming you already have a collector, configuring it to export data to Jaeger can be done by adding the following configuration to the collectors config.yaml:
Define a Jaeger exporter under “exporters”:
jaeger:
    endpoint: localhost:14250
    tls:
      insecure: true
Add the exporter to the the traces pipeline:
service:
  pipelines:
    traces:
      receivers: [otlp]
      exporters: [logging, jaeger]
Adding Visualization of Tracing Data and Actionable Insights
Helios is a microservices troubleshooting and testing solution that is based on OpenTelemetry’s distributed tracing. Helios leverages tracing data to provide complete visualization of microservices, messaging systems, data pipelines and databases. Together with actionable data insights that Helios provides, developers can use this tool to find and fix issues before production.
Helios vs. Jaeger
While both solutions might seem to possess similar capabilities, there are differences between them. Jaeger is an excellent open-source tool. Helios adds additional layers of features and capabilities that provide more information to developers for troubleshooting and testing. These include:
1. Trace visualization
Visualizing your system enables seeing into complex sync and async workflows, understanding the dependencies between different components and detecting changes across versions. This visibility is key to troubleshooting your applications.
Jaeger provides a trace visualization view, but it is limited to a timeline view that gets cumbersome for large, complex traces.
Here’s what a Jaeger trace visualization looks like:
In Helios, on the other hand, the same information will look like this:
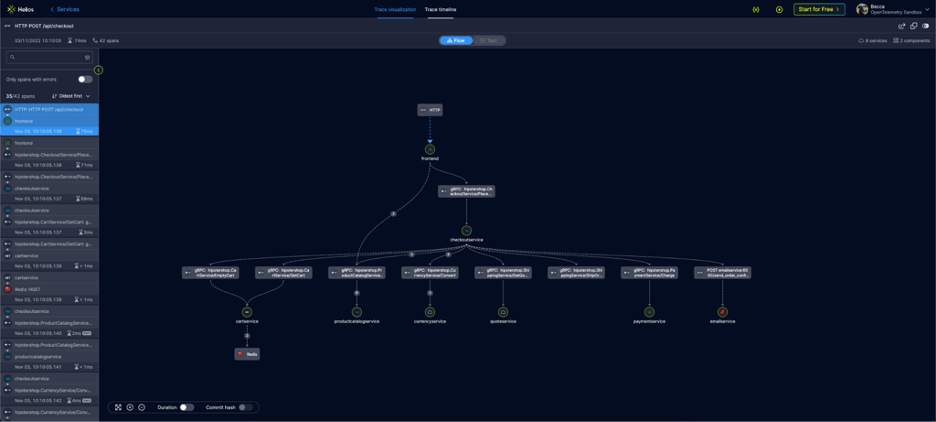
Source: otelsandbox.gethelios.dev
As you can see, a quick glance at the Helios distributed tracing UI is enough to understand the architecture and identify workflows and dependencies. A simple drill-down provides information about issues and errors. Developers can quickly realize the problem and proceed to fix it. You can see how it works and play with it by using a Jaeger trace visualization tool we developed (that doesn’t require signup).
Related article: Distributed tracing visualization: Get advanced visibility into your app flows when using Jaeger tracing
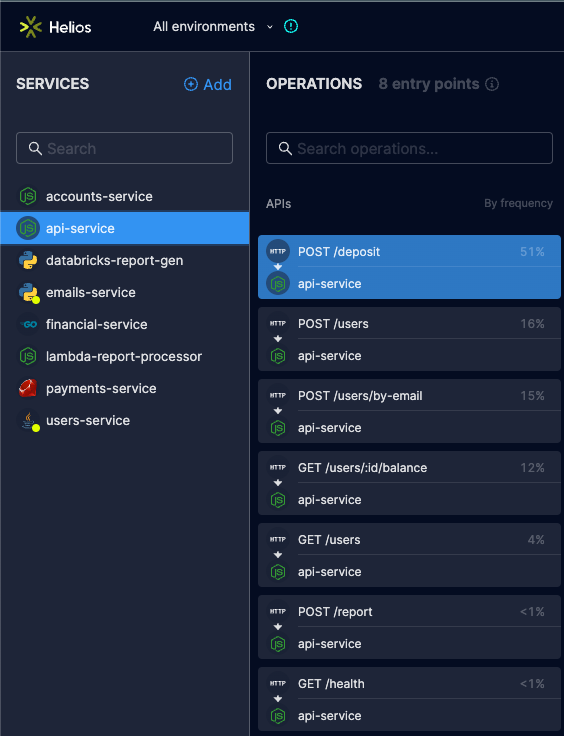
2. API Catalog
An API catalog provides developers with a full dynamic view of all their APIs – both public and private. It enables developers to understand the structure of their system and to drill down into the behavior of specific APIs. Helios provides a full sync and async API catalog, including HTTP, gRPC, GraphQL, Kafka, RabbitMQ, and serverless APIs. Jaeger does not provide this view into the system.
3. Microservices Testing Capabilities
Testing is an important stage in the development lifecycle, as it helps prevent regressions and bugs before production and saves valuable time. Writing the tests can be time-consuming, especially in distributed environments.
Helios uses distributed tracing data to automatically create microservices tests, instead of developers having to script them. In a few simple setup steps, Helios generates test code, collects relevant data, runs parameterization, and more. This significantly reduces the time and overhead developers spend on building and running end-to-end tests.
Jaeger, on the other hand, does not provide testing capabilities and requires developers to complement Jaeger with testing on their own.
4. E2E Flow Replaying
Replaying API calls in distributed applications can help reproduce issues to identify functional and performance issues. After fixing a problem in a feature, reproducing it helps ensure that the update version will work, error-free. But reproducing calls is not easy – it requires finding the endpoints, collecting the relevant payloads, setting up the services, and more.
Helios provides flow-replaying capabilities that can replay requests to API endpoints, message queues, Lambda functions, and more. The flow can be triggered as a script, a cURL command or Postman request. Read more here.
When using Jaeger, developers are required to replay solutions on their own, either by building them manually or finding another solution to do it for them.
Using Jaeger Tracing with Helios
If you’re already using Jaeger Tracing, you can connect it to Helios through your OpenTelemetry collector. Additionally, its timeline view is included in Helios’ trace visualization. It’s easy to switch between the trace graph and the timeline. This will enable you to keep using Jaeger and leverage the additional capabilities that Helios provides.


