


Message brokers like Kafka enable microservices to scale. But this same quality makes them hard to troubleshoot. How can developers avoid messages and errors getting stuck in oblivion? In this post we look at a few solutions: Kafka Owl, Redpanda, and Helios.
A short reminder of why message brokers sometimes break
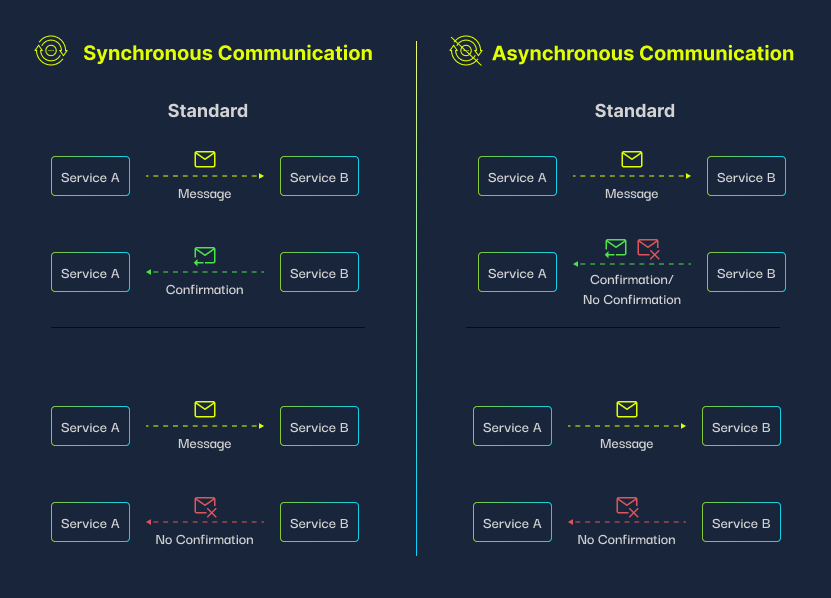
Distributed systems like microservices communicate with each other through frameworks like REST, gRPC, or message brokers (such as Kafka). While each method has its own advantages, message brokers are reliable and enable complex flows since they are based on asynchronous communication.
Asynchronous communication means that a message sent by a service (the producer) doesn’t have to be immediately consumed. Instead, the message can be stored in a message queue and consumed by another service (the consumer) at another time. For example, based on availability or need.
This ensures reliability and redundancy. Messages do not get lost or become stateless. As a result, systems can scale.
One of the most popular message broker systems is open-source Kafka. Kafka supports high performance and high scalability and enables permanent storage. For these reasons and others, Kafka is widely used by many companies.
While there is probably no better replacement for microservices communication than message brokers, they do pose some challenges. Mainly, it is very difficult to identify and troubleshoot errors. In synchronous communication frameworks, a lack of immediate response to a message is a clear indicator that there is an error in the system. But in asynchronous communication, there might be an error, but since there is no message feedback, no one would ever get an alert.
Solutions for monitoring microservices in message brokers
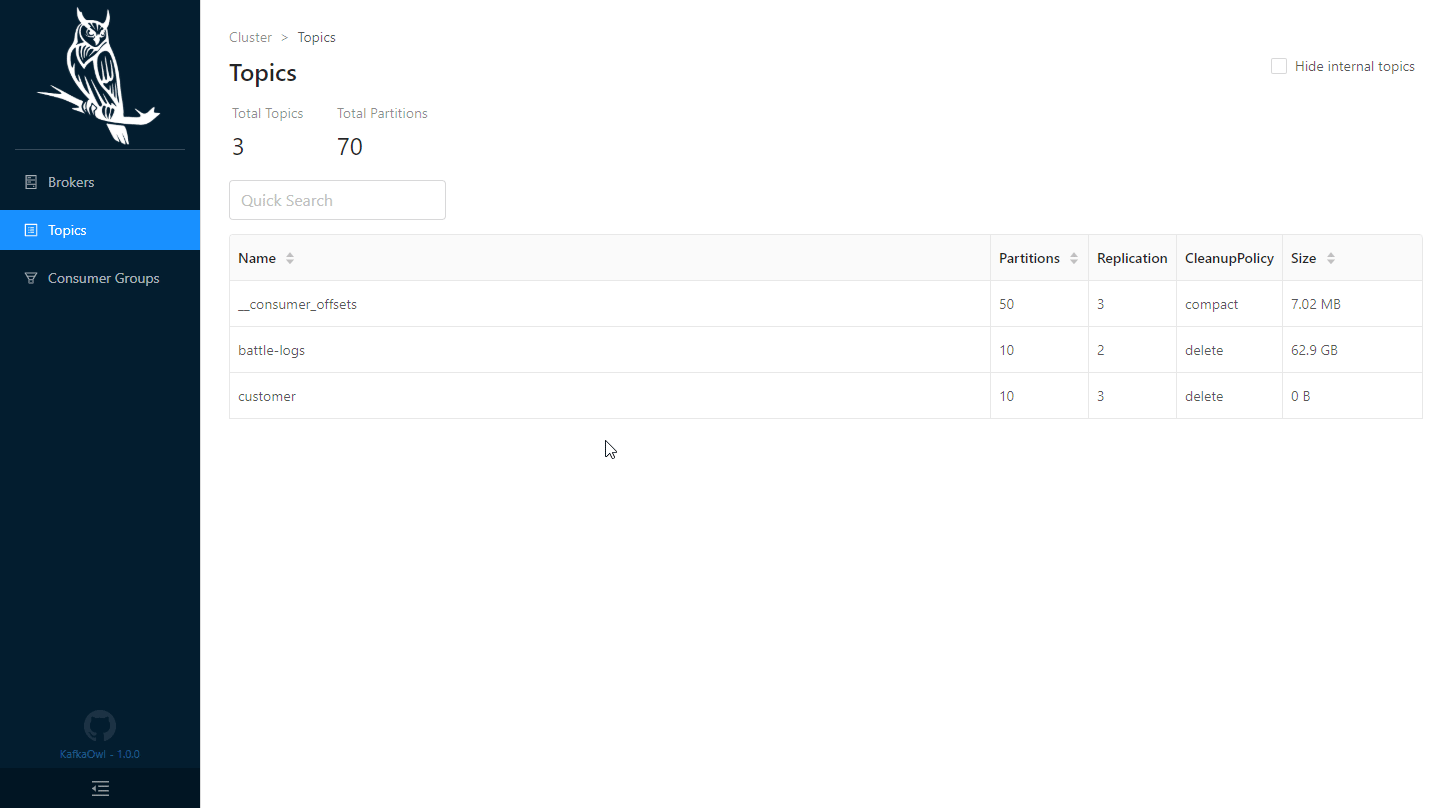
Solutions like Kafka Owl and Redpanda enable monitoring messages in message brokers. Kafka Owl enables exploring and fetching messages in Kafka clusters while Redpanda enables exploring message topics.
The challenge with existing monitoring solutions: message error context for troubleshooting
However, these solutions do not provide the context of the message requests. As developers, we lack an understanding of why a certain message created an issue. We only see the details of the error, but not the big picture.
As a result, we’re not able to:
- Easily reproduce, troubleshoot, and debug the issue
- Prevent this issue from recurring
In other words, we might have more information from before, but we’re still spending a lot of time dealing with microservices issues, which doesn’t really solve our problem. developers struggle to understand what is happening and the traditional existing (log based) solutions are insufficient for troubleshooting and debugging.
The solution: trace-based monitoring and troubleshooting of message brokers
Traces can solve this Kafka and other message brokers context issue because they allow us to see all the operations that are triggered in our distributed system, no matter the communication type: REST, Kafka, GRPC or others.
This happens through a single operation, making it easy to approach each operation and see it as part of a whole, and not as an individual action. In addition, traces can be created automatically, without a developer having to decide where to insert them, unlike logs.
Traces can give the full context of a message, including its flow and behavior between different components and services. This makes them the ideal solution for troubleshooting. When an error occurs, developers can see its complete context within the microservices architecture, making it easy to troubleshoot and fix.
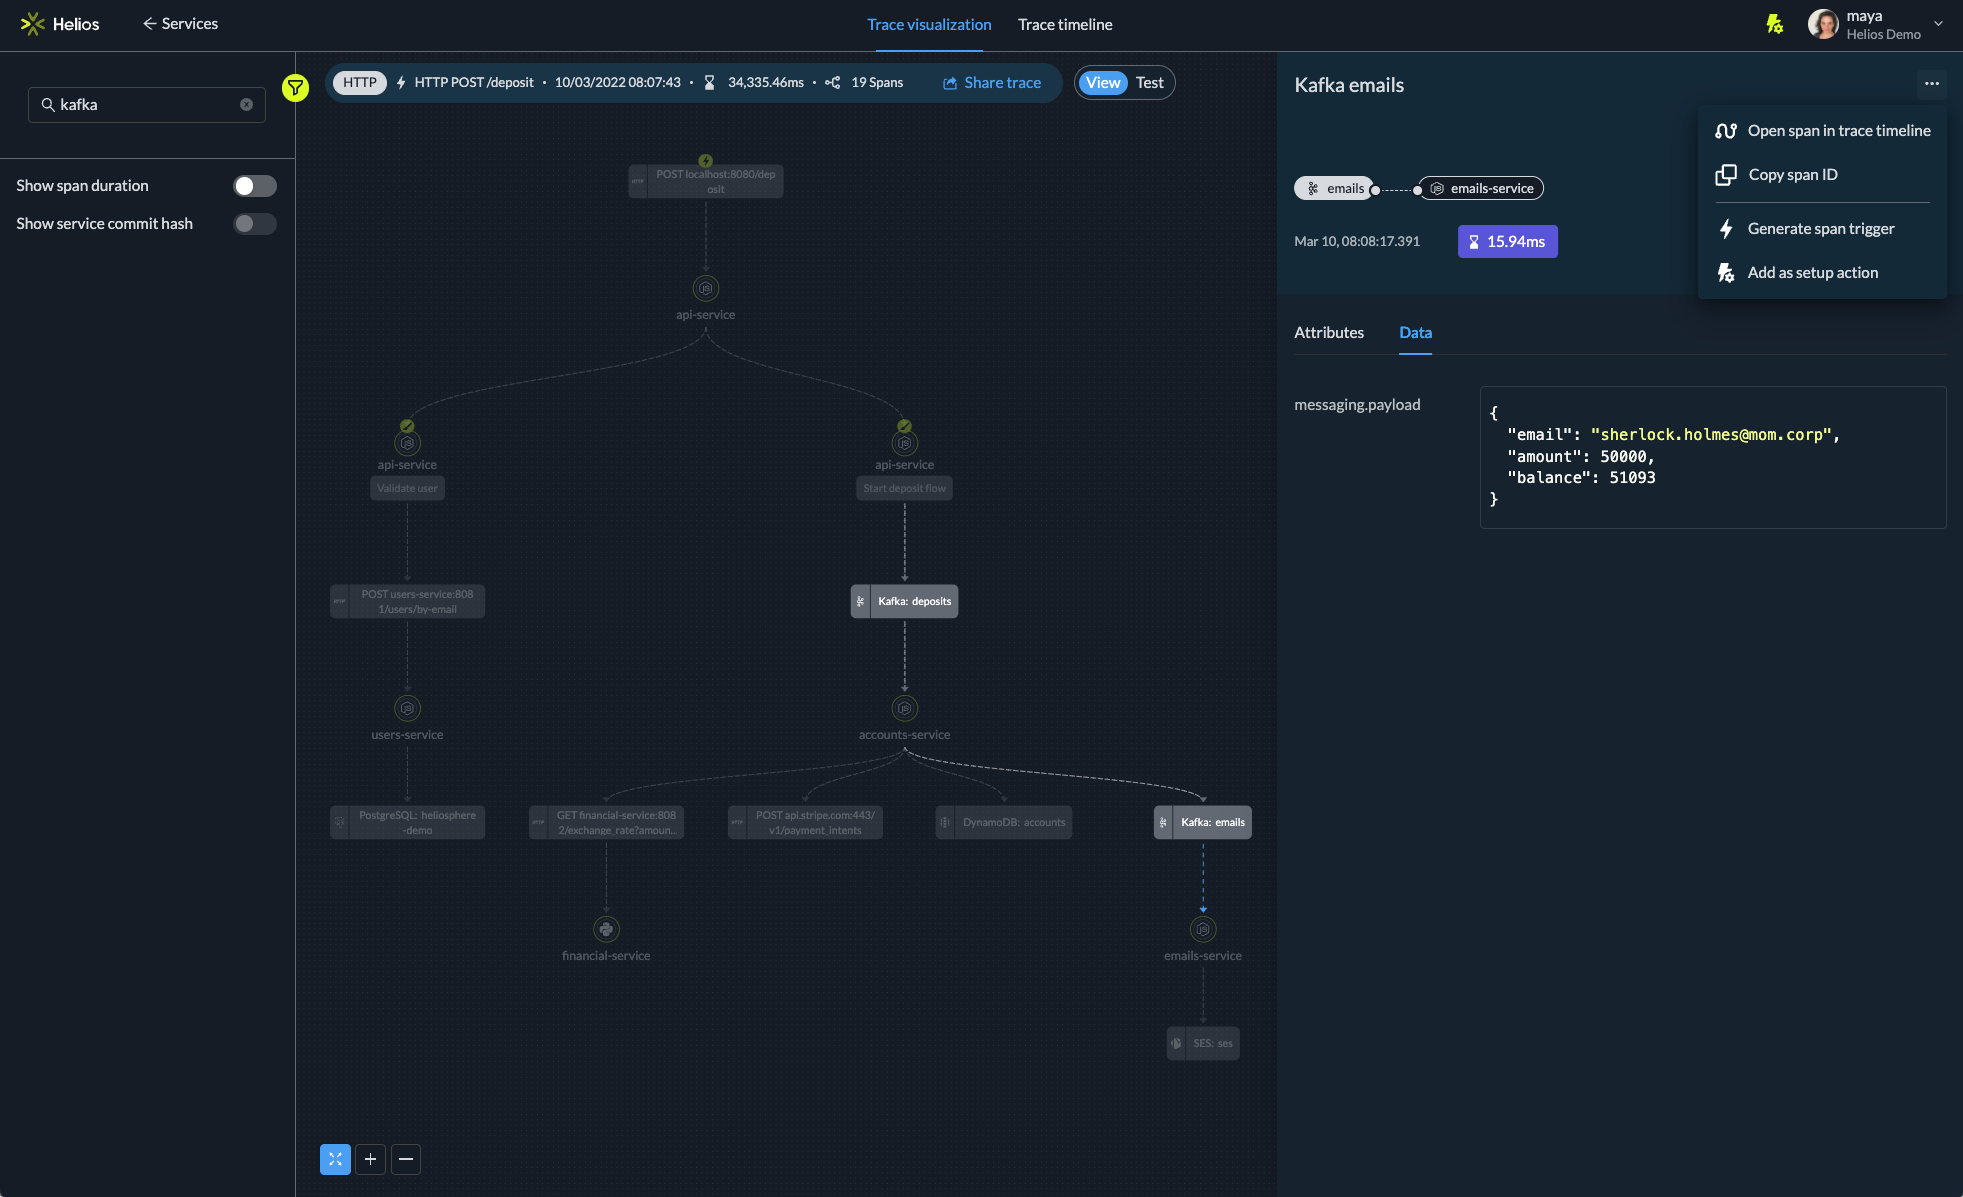
Helios provides a free trace-based solution for troubleshooting message brokers like Kafka. With Helios, we can look at the Kafka messages through their traces. This provides the context of the message, i.e which services it is connected to, where and why the error occurred, and more.
Helios is based on open-source OpenTelemetry, and leverages traces for visualization and for making the data actionable. It lets developers understand sync and async flows, event streams, and queues; search through traces and identify bottlenecks and errors.
In short: OpenTelemetry is a key tool to collect data from the different transactions within services and components (including various message brokers like Kafka) and understand the performance and behavior of the app.
More about distributed tracing
Distributed tracing is an approach to tracking application requests as they flow from frontend devices to backend services and databases. Developers use distributed tracing to troubleshoot requests that exhibit high latency or errors. it defines spans and traces. A trace tracks the progression of requests across the services, message brokers, and other components. A trace is actually like a tree of spans. A span represents an event between services – for instance, sending a message to Kafka topic.
Traces include data such as the length of each request, the components it involves, latency parameters, and more. OpenTelemetry enables distributed tracing through instrumentation (code that creates the spans). This data is sent to a backend and next, there’s a need to visualize the data and generate error insights.
in the Image below you can see a visualization of a trace, and the contextual data related to it:
One of our customers, a marketing platform that produces tens of thousands of message requests every day in a Kafka-based architecture, was not able to identify the root cause of issues. Errors occurred in approximately one in a few thousand messages, which made combing through logs ineffective. But, by visualizing the issue in a trace-based view, they are able to reproduce issues and prevent them from occurring.
Try Helios for yourself and monitor your own message brokers.
Related:
Distributed tracing – all you need to know


