


When testing distributed applications, logs and traces generated from microservices are often not available, leaving developers in the dark. Here’s how test instrumentation with OpenTelemetry helps solve this challenge.
“Cloud native” – working in distributed systems using microservices and DevOps – has promised a lot, and indeed delivered a lot. Among the biggest benefits, in a cloud-native distributed architecture it’s easier and more cost-effective to scale parts of an application. When one part fails, it is less likely to impact other services and the services can still communicate with each other. And, the ability to easily plug microservices into the architecture enables faster application development, innovation, and time-to-market. But it brought on the issue of observability to test runs.
Many challenges remain in cloud native deployments, one of which is debugging tests. You have a test one day and it passes, the next day it stops working. In distributed environments, testing frameworks don’t provide good transparency into what failed. Similar to how application flows in microservices architectures are handled by multiple services and cloud entities, so too are test flows, making it hard to get a complete picture of what happened behind the scenes. Even if engineers know where to look, the logs are usually not accessible to them, and often, the only indication for what went wrong is the failed assertion which doesn’t tell the whole story.
Enter OpenTelemetry (OTel), the emerging standard for instrumenting, generating, collecting, and exporting distributed tracing telemetry for analysis and software performance monitoring. Distributed tracing is a mechanism of observing requests as they flow through distributed cloud environments. The reason tracing has been such a boon for working in these environments is because it provides visibility into, and connects the dots between, the relationships and dependencies between microservices components.
At Helios we use OTel to provide developers with distributed tracing data, giving them visibility for test runs with insights into how data flows through their applications, and enabling them to quickly identify, reproduce and resolve issues in their flows. Just as to application flows, we extend these exact same capabilities to test flows, including providing visibility and troubleshooting into current tests in your system.
Before I get into how we do that, let’s look at an example of common testing and why it’s difficult to get visibility into tests of distributed applications.
Visibility for test runs in distributed environments
As developers ourselves, we understand the importance of tests. Engineering organizations invest in tests to: (a) increase the quality of their product; (b) have confidence to build features and not feel hesitation before making changes; and (c) deliver features faster. But what if we don’t have visibility into our test runs? How can we know what happens to a test when it’s executed, what the test touches, why validations didn’t pass, where the test fails and how to troubleshoot it?

Let’s look at an example. You’re running a UI test in a browser that completes actions in a web application mimicking a real user. A user goes into an e-commerce website, searches for a product, adds it to their cart, and then checks out. All of these UI actions can be simulated with UI testing frameworks like Cypress, Playwright, Puppeteer, Selenium, etc. On the e-commerce site, users are logging in, clicking, typing, etc. resulting in a lot of microservices at play behind the scenes – HTTP requests, DB transactions, third-party API calls, published messages, and so on. The UI test checks that all these actions are working. But let’s say one of the services doesn’t perform as expected. For example, even though a “purchase completed” message appeared, the user did not receive an email confirming the purchase. Several things could have led to this scenario. Maybe something in the backend failed, or there was a communication failure between services. You’re not able to see this in the UI.
Discovering the failure itself is difficult, let alone knowing what caused it. This is because, when testing a distributed application, you’re essentially facing similar challenges as when building a distributed application – but you have even less data. Identifying and troubleshooting issues throughout the various stages of development (local, staging, production) has also become complicated, but at least you can access the raw data to search for errors – in logs, for example. In test environments, which are built as similarly as possible to production (except for the scale), these logs generated from other microservices are often not available, so troubleshooting becomes cumbersome. It takes time, sometimes hours, to even begin to know what to investigate when a test fails, often blocking the CI/CD process.
Test Instrumentation
To address the issues mentioned above, you can leverage OTel to instrument your tests. With instrumentation you benefit from the following:
- Observability – you can capture test runs as traces, enabling you to visualize and monitor them.
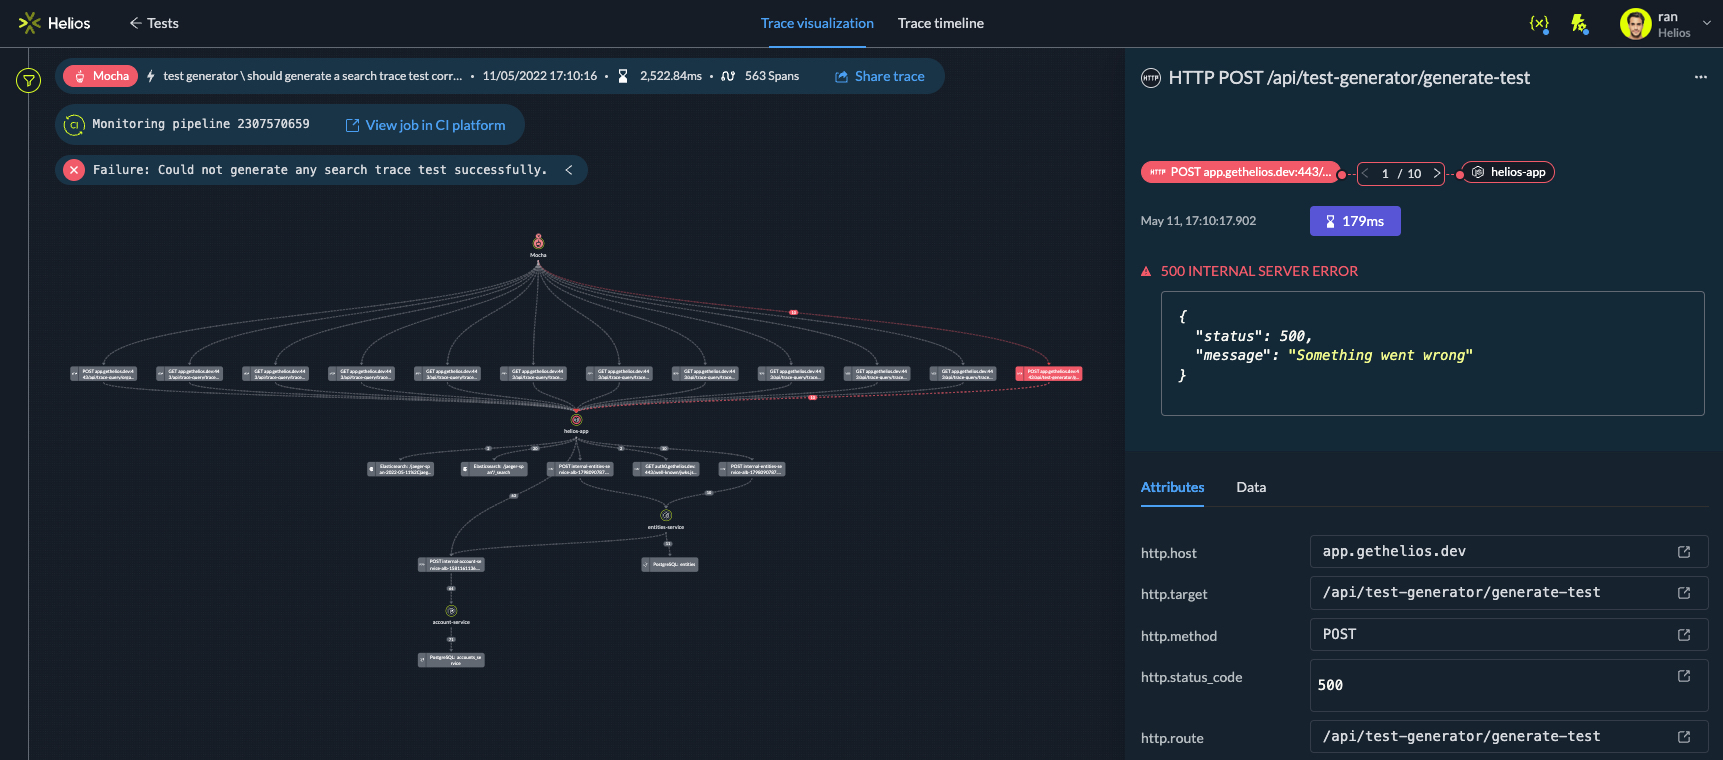
Visualizing test runs as traces enables quick troubleshooting and speedy insights into what went wrong - Debugging – you can make asserts available to easily understand why the test failed.
You can also link to a trace visualization from the console where you’re running your tests.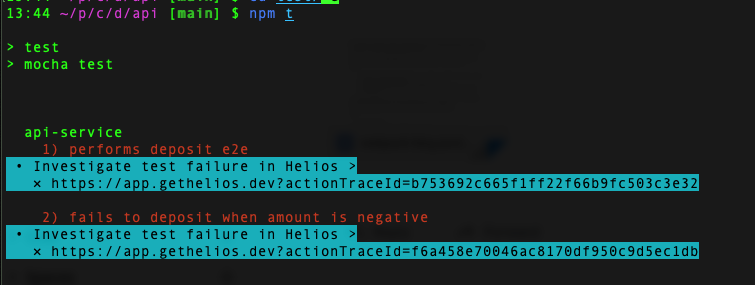
Investigate test results in Helios directly from your console - Test overview – you can view the data in an organized way, seeing tests that ran including those that passed and failed.
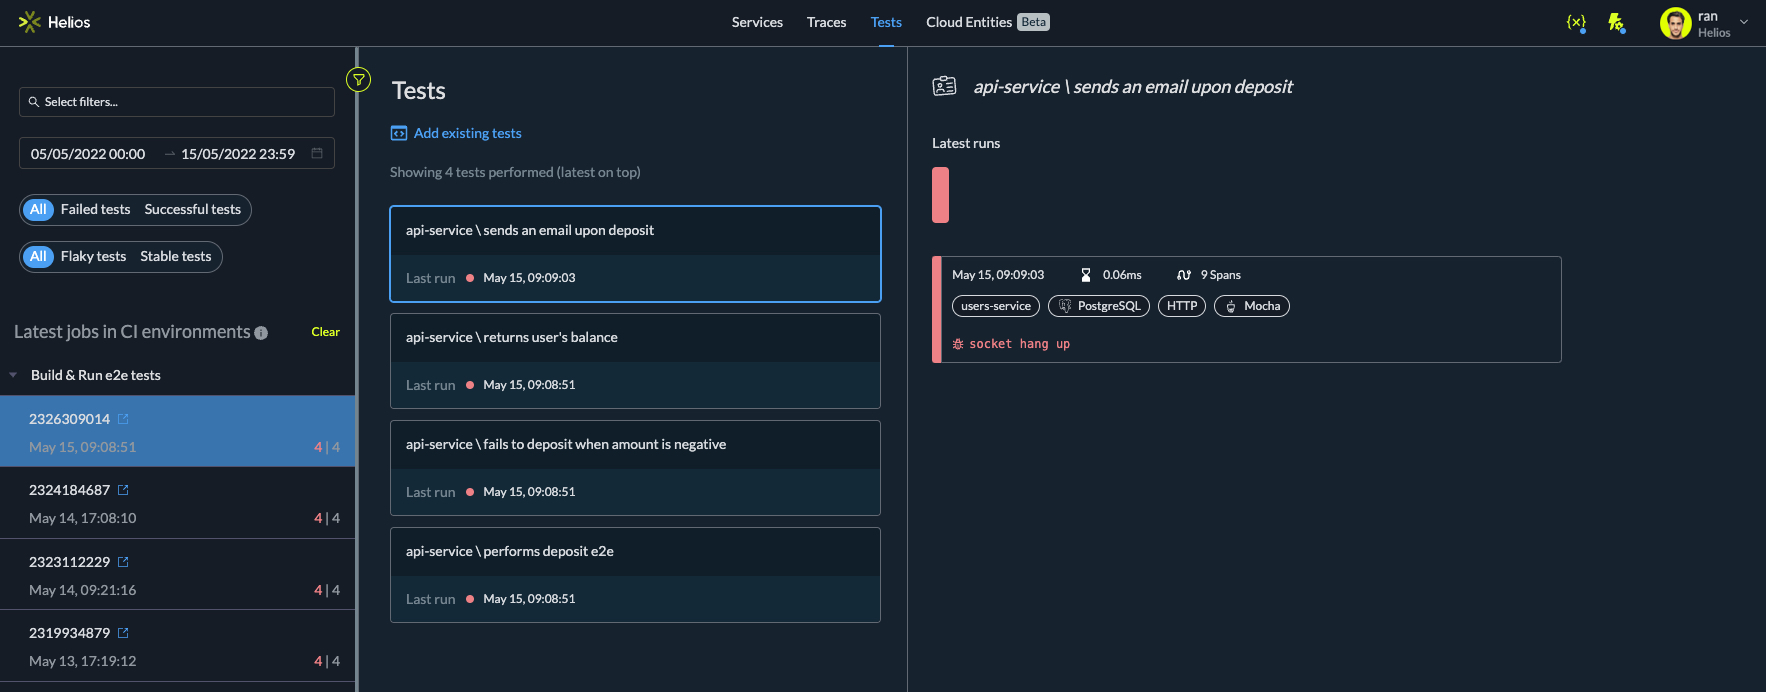
Overview of all tests and test runs
Helios leverages OTel to instrument your existing tests, providing visibility and troubleshooting, and therefore shortening the process of investigating issues. Distributed tracing telemetry shows a test run as a trace, an aggregate of spans; this allows us to seamlessly apply all the capabilities we’ve built to help you troubleshoot application flows – to troubleshoot test runs as well.
We integrate with common testing frameworks (Cypress, Jest, Mocha, pytest, and more), connecting between a test run and the trace that was generated from the test. When a test runs, all the actions from the test are aggregated in the same trace so that it’s easy to visualize what’s happening and quickly pinpoint where things fail.
Showing some love to testing
Developing cloud native applications can be challenging for many reasons, one of which is debugging tests. When it comes down to it, it’s not less complicated to test distributed apps than to build them. We’ve focused this blog on troubleshooting testing because it hasn’t received much attention until now and we’re eager to change that. At Helios, we’re lucky that we get to take advantage of great capabilities from OTel and apply them to help developers work more efficiently, both with their application flows and test runs. We ourselves use our own product (multiple times a day) to debug our microservices and tests to improve our dev velocity and product quality.


