


OpenTelemetry in a Nutshell
Microservices architecture has become the new norm for modern applications due to its numerous advantages compared to traditional monolithic architecture. However, microservices also come with several challenges. Especially when it comes to observability and monitoring. Traditional monitoring tools and techniques can no longer handle microservices’ distributed and dynamic nature.
This is where OpenTelemetry distributed tracing comes in. It’s an open-source observability framework that allows developers to capture telemetry data from distributed cloud-native applications. It provides APIs, tools, and SDKs to collect and generate traces, metrics, and logs. OpenTelemetry can be used with multiple programming languages, including Python, Java, JavaScript, Go, Ruby, and C++.
One of its key features is its ability to capture and propagate distributed traces and spans across different services and components. It also supports capturing and exporting metrics like request latency, error rates, and resource usage that can be used to monitor and generate alerts on various aspects of the system.
Compared to traditional monitoring approaches, OpenTelemetry has many advantages and resolves several pain points.
- OpenTelemetry provides a unified and standardized method for collecting telemetry data, simplifying the correlation and analysis of data from various sources.
- It supports multiple export formats, including popular observability platforms like Prometheus, Jaeger, and Zipkin.
- It’s a vendor-agnostic, future-proof, and community-driven solution that ensures interoperability and extensibility.
In this article, we will guide you through the process of Python tracing by using OpenTelemetry with Python to capture and export traces and metrics from your applications. We will discuss the essential components of OpenTelemetry and provide examples of integrating it with popular observability platforms and leverage Python trace visualization techniques to speed up troubleshooting.
OpenTelemetry Python Tutorial- Installation Walkthrough
Installing OTel in Python enables Python observability monitoring and tracking (I will later on also share some info about Python monitoring tools that offer additional value on top of OTel). As you will see now, it is pretty straightforward. You can either use the OpenTelemetry manual instrumentation approach or the OpenTelemetry auto instrumentation approach. Here, I will walk you through both methods using a simple Flask application and OpenTelemetry Python SDK
Prerequisite – Creating the Python application
Install the Flask framework using pip3 install flask command, and create a file named server.py. Then, update it with the code below.
from flask import Flask

import random

app = Flask(name)

@app.route('/random')

def index():
  number = random.randint(0,100)
  return 'Random Number : %d' % number

app.run(host='0.0.0.0', port=8000)
The above code will return a random number between 0 and 100 when the endpoint is called. You can test it by running the project using the flask run –app server.py command.
OpenTelemetry Manual Instrumentation
First, I will take you through the sets of OTel manual instrumentation.
Step 1 – Installing OpenTelemetry libraries
Install opentelemetry-api and opentelemetry-sdk libraries to start instrumenting your Python applications with OpenTelemetry.
pip install opentelemetry-api

pip install opentelemetry-sdk
Once the libraries are installed, you can add a tracer object to your server.py file using the following code:
from opentelemetry import trace

from opentelemetry.sdk.resources import Resource

from opentelemetry.sdk.trace import TracerProvider

from opentelemetry.sdk.trace.export import BatchSpanProcessor

from opentelemetry.sdk.trace.export import ConsoleSpanExporter


provider = TracerProvider()

processor = BatchSpanProcessor(ConsoleSpanExporter()) #

provider.add_span_processor(processor)

trace.set_tracer_provider(provider)

tracer = trace.get_tracer(name)
The above configuration includes a provider, a processor, and a tracer. The provider (TracingProvider), serves as the API entry point that holds the configuration. The processor specifies how to send the created spans forward. The tracer, on the other hand, is the actual object that generates the spans.
Step 2 – Adding a tracer to the Flask route
Then, you can add a tracer object to the Flask route like the below:
@app.route('/random')

def index():

  with tracer.start_as_current_span("server_request"):

   number = random.randint(0,100)

   return 'Random Number : %d' % number


app.run(host='0.0.0.0', port=8000)
Then, restart the application and call the route to see the tracing information in the console.
{

    "name": "server_request",

    "context": {

        "trace_id": "0x9f1bcbe7c34237ead06a35162f37dc83",

        "span_id": "0x2d42807b6e77dbe4",

        "trace_state": "[]"

    },

    "kind": "SpanKind.INTERNAL",

    "parent_id": null,

    "start_time": "2023-03-16T17:24:07.025035Z",

    "end_time": "2023-03-16T17:24:07.025035Z",

    "status": {

        "status_code": "UNSET"

    },

    "attributes": {},

    "events": [],

    "links": [],

    "resource": {

        "attributes": {

            "telemetry.sdk.language": "python",

            "telemetry.sdk.name": "opentelemetry",

            "telemetry.sdk.version": "1.15.0",

            "service.name": "unknown_service"

        },

        "schema_url": ""

    }

}
However, the above tracing information does not provide much information besides the span ID, trace ID, and start and end times. So, let’s see how we can get more insights.
Step 3 – Updating the span to get more insights
We can get more details by adding an event to the random number generation function.
@app.route('/random')

def index():

  with tracer.start_as_current_span(

    "server_request",

    attributes={ "endpoint": "/random"

  }):

   span = trace.get_current_span()

   number = random.randint(0,100)

   span.add_event( "log", {

      "random number": number

    })

   return 'Random Number : %d' % number


app.run(host='0.0.0.0', port=8000)
In the above example, we start by adding an attribute to the span in the tracing start method. Then, we retrieve the current span and add an event to be triggered with each API call.
{

   "name": "server_request",

    "context": {

        "trace_id": "0x9f0f2b9c658a1dba5ab169a19c4c226b",

        "span_id": "0x9d18fdc373ae912a",

        "trace_state": "[]"

    },

    "kind": "SpanKind.INTERNAL",

    "parent_id": null,

    "start_time": "2023-03-17T18:17:39.626005Z",

    "end_time": "2023-03-17T18:17:39.626005Z",

    "status": {

        "status_code": "UNSET"

    },

    "attributes": {

        "endpoint": "/random"

    },

    "events": [

        {

            "name": "log",

            "timestamp": "2023-03-17T18:17:39.626005Z",

            "attributes": {

                "random number": 64

            }

        }

    ],

    "links": [],

    "resource": {

        "attributes": {

            "telemetry.sdk.language": "python",

            "telemetry.sdk.name": "opentelemetry",

            "telemetry.sdk.version": "1.15.0",

            "service.name": "unknown_service"

        },

        "schema_url": ""

    }

}
As you can see, now, the tracing log provides more insights, including the endpoint, timestamp of the API call, and the result.
OpenTelemetry Automatic Instrumentation
Instead of manually configuring attributes and events, you can use OpenTelemetry automatic instrumentation to standardize the process. It allows instrumenting your application without code modifications using monkey patching or bytecode injection.
However, automatic OTel instrumentation has limitations and is not as straightforward as a span per function. Instead, it is custom-implemented for several frameworks in a significant manner. Hence, it is necessary to check the supported frameworks before you start.
Step 1 – Installing OpenTelemetry libraries
First, you need to install opentelemetry-instrumentation-flask using the below command.
pip install opentelemetry-instrumentation-flask
Else, you can use opentelemetry-bootstrap -a install command to install auto instrumentation packages for all Python frameworks.
Step 2 – Running the application
Now, you do not need any code modifications. You can simply run the application with a few additional command line arguments.
opentelemetry-instrument –traces_exporter console flask run
The above command uses –traces_exporter flag to export the traces to the console. You can find more on other configuration options here.
{

    "name": "/random",

    "context": {

        "trace_id": "0x541995dffa03529463f2885661ba2550",

        "span_id": "0xde86468a94d54239",

        "trace_state": "[]"

    },

    "kind": "SpanKind.SERVER",

    "parent_id": null,

    "start_time": "2023-03-18T16:43:57.553799Z",

    "end_time": "2023-03-18T16:43:57.554797Z",

    "status": {

        "status_code": "UNSET"

    },

    "attributes": {

        "http.method": "GET",

        "http.server_name": "127.0.0.1",

        "http.scheme": "http",

        "net.host.port": 5000,

        "http.host": "127.0.0.1:5000",

        "http.target": "/random",

        "net.peer.ip": "127.0.0.1",

        "http.user_agent": "Mozilla/5.0 (Windows NT 10.0; Win64; x64) AppleWebKit/537.36 (KHTML, like Gecko) Chrome/111.0.0.0 Safari/537.36",

        "net.peer.port": 56717,

        "http.flavor": "1.1",

        "http.route": "/random",

        "http.status_code": 200

    },

    "events": [],

    "links": [],

    "resource": {

        "attributes": {

            "telemetry.sdk.language": "python",

            "telemetry.sdk.name": "opentelemetry",

            "telemetry.sdk.version": "1.15.0",

            "telemetry.auto.version": "0.36b0",

            "service.name": "unknown_service"

        },

        "schema_url": ""

    }

}
As you can see, the above trace log shows more details than the manual instrumentation process, and we didn’t have to make any manual code modifications.
Adding Advanced Visualization and Context for Python Spans and Traces
Trace visualization offers advantages that aren’t available otherwise. Tools like Jaeger offer visibility into spans and traces by providing basic visualization to see each span’s start and end times, relationships, and contextual information, such as the span ID and trace ID. However, these tools do not fully leverage the potential of OpenTelemetry. They have some significant limitations, like the lack of advanced visualization options, providing limited context, and missing data on the calls. Hence, we need tools with more advanced visualization and context support to get the maximum from the OTel Python instrumentation.
That’s where tools like Helios come in. It is a developer-observability solution built on OpenTelemetry that provides actionable insight into the end-to-end application flow. Recently, I used Helios with a Python (Flask) application, and it provided some amazing features like advanced visualizations, bottleneck identification, workflow reproduction, trace-based test generation, and end-to-end visibility.
So, let’s see how to integrate Helios with Python – OpenTelemetry instrumentation to increase observability while reducing the troubleshooting and debugging time.
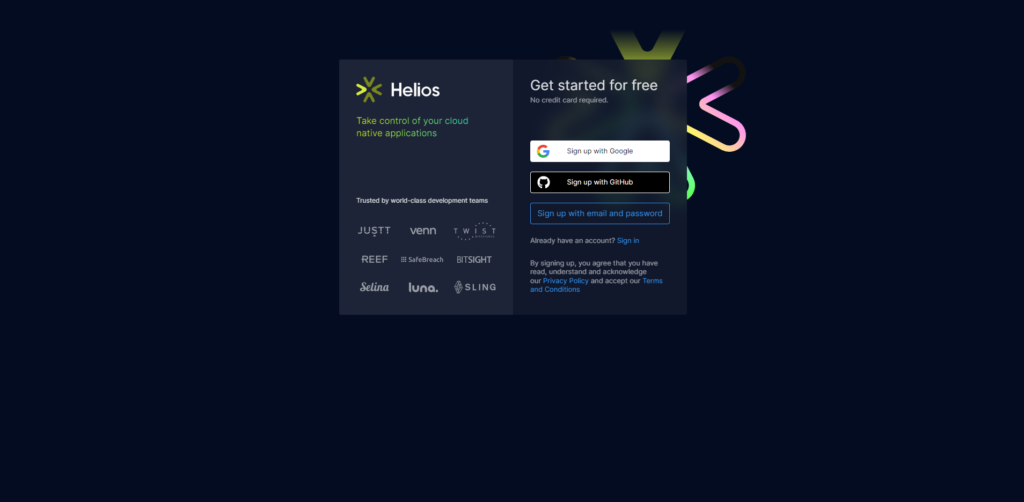
Step 1 – Create a Helios Account
First, create a new Helios account.
Once the account is created, you will get a UI like the one below with installation commands and configurations for all the languages supported by Helios.
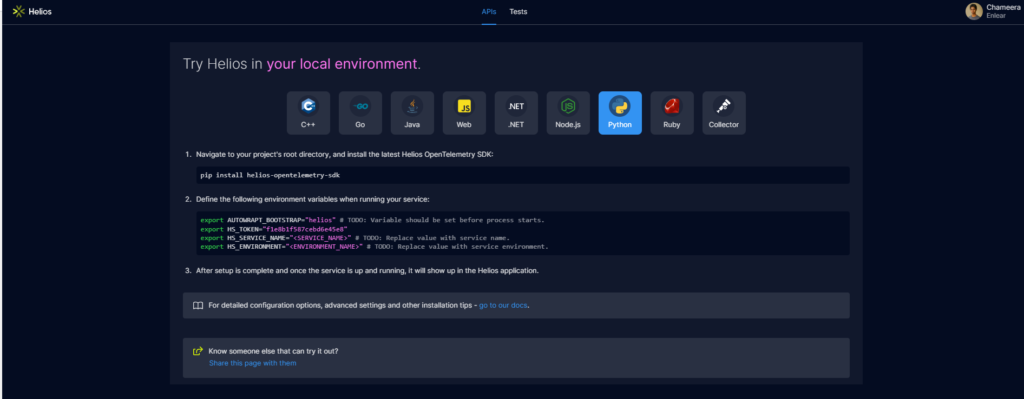
Step 2 – Installing Helios Python SDK
Install Helios SDK for your Python application with the below code:
pip install helios-opentelemetry-sdk
Then, all you need to do is set the environment variables, as in the screenshot from step 1.
export AUTOWRAPT_BOOTSTRAP="helios" # TODO: Variable should be set before process starts.

export HS_TOKEN="6ec524268408451d9854"

export HS_SERVICE_NAME="<SERVICE_NAME>" # TODO: Replace value with service name.

export HS_ENVIRONMENT="<ENVIRONMENT_NAME>" # TODO: Replace value with service environment.
If not, you can import Helios and initialize a connection using the token. But the recommended way is to use environment variables.
from flask import Flask

import random

from helios import initialize


initialize(

  api_token='f1e8b1f587cebd6e45e8', # Insert API Token here.

  service_name='my-python-service', # Insert service name.

  enabled=True,        # Defaults to False if omitted.

  environment='DEPLOYMENT_ENV',  # Defaults to os.environ.get('DEPLOYMENT_ENV') if omitted.

  commit_hash='COMMIT_HASH',  # Defaults to os.environ.get('COMMIT_HASH') if omitted.

)


app = Flask(name)


@app.route('/random')

def index():

  number = random.randint(0,100)

  return 'Random Number : %d' % number


app.run(host='0.0.0.0', port=8000)
Step 3 – Observe the Trace Visualizations
Now, restart the application and refresh the Helios dashboard to get the actionable data of your application.
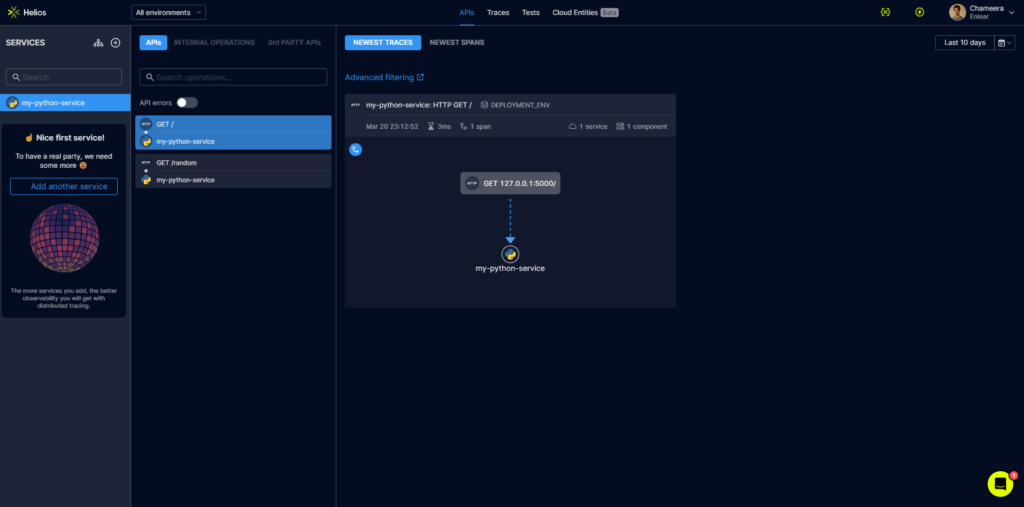
As you can see, Helios provides more advanced visualization and context for spans and traces in your Python application compared to stand-alone OTel or Jaeger.
The API tab lists all the API endpoints of the applications, and you can get trace and span data on each API by clicking on them.
The Traces tab will list all the traces, and you can get trace visualizations and timelines by clicking on them.
As the number of services and endpoints increase, visualizations and insights provided by OpenTelemetry can be incredibly helpful in troubleshooting and debugging your applications. Most importantly, the entire process only requires two simple steps.
Learn more about the Python SDK configuration in Helios
Conclusion
This article discussed the importance of OpenTemeletry in modern microservices architecture and the step to manually and automatically instrument your Python applications with OpenTelemetry, it also shares OpenTelemetry python examples. However, troubleshooting modern distributed applications requires more insights and actionable data to identify the issues to reduce the MTTR. Hence, getting familiar with advanced visualization and context tools like Helios is important to make your work much easier.
Thank you for Reading.


