

How I use Helios to reproduce issues, solve them and build my distributed application (Helios!) faster.
Within the technology stack used by developers today you would be hard-pressed not to find products and features that save time. Time-saving tools are crucial for developers because we look for ways to deliver production-ready code faster to keep up with the demands of our users and customers. We want to be able to identify, reproduce, and fix issues – fast, especially when working with distributed applications.
This is why, at Helios, we’ve developed the ability to replay flows to enable developers to reproduce calls in their distributed applications. Our product is based on OpenTelemetry (OTel) – an emerging standard for collecting telemetry data (traces, metrics, logs) to better understand software behavior and performance. One thing that differentiates us from other developer platforms based on OTel is that we collect all payloads (HTTP request and response bodies, message queues content, and DB queries and results) to allow users to create those flow triggers, among other things.
In this blog post, I’ll share how replaying flows helps me get my job done everyday – using Helios to build Helios – in a faster and less tedious way.
What are flow triggers?
A flow trigger is an entry point to an application which leads to an event or a series of events. For example, a classic flow trigger would be an HTTP request to a REST API call, an action which is reproducible by using Postman or cURL or even your browser, and can be a bit more complicated to reproduce if you need a payload or authorization headers, for example. In some cases, you would want to trigger an action in your system that is not necessarily an HTTP call – it could be a call to a database, a message sent to Kafka, or a RabbitMQ message.
At Helios, based on the data that we collect in your distributed application, we enable you to replay not only requests to API endpoints, but also to message queues, Lambda functions, CloudWatch events, K8s jobs, and other systems that are less accessible than the old-known and easy-callable API endpoints.
What are the benefits of replaying flows?
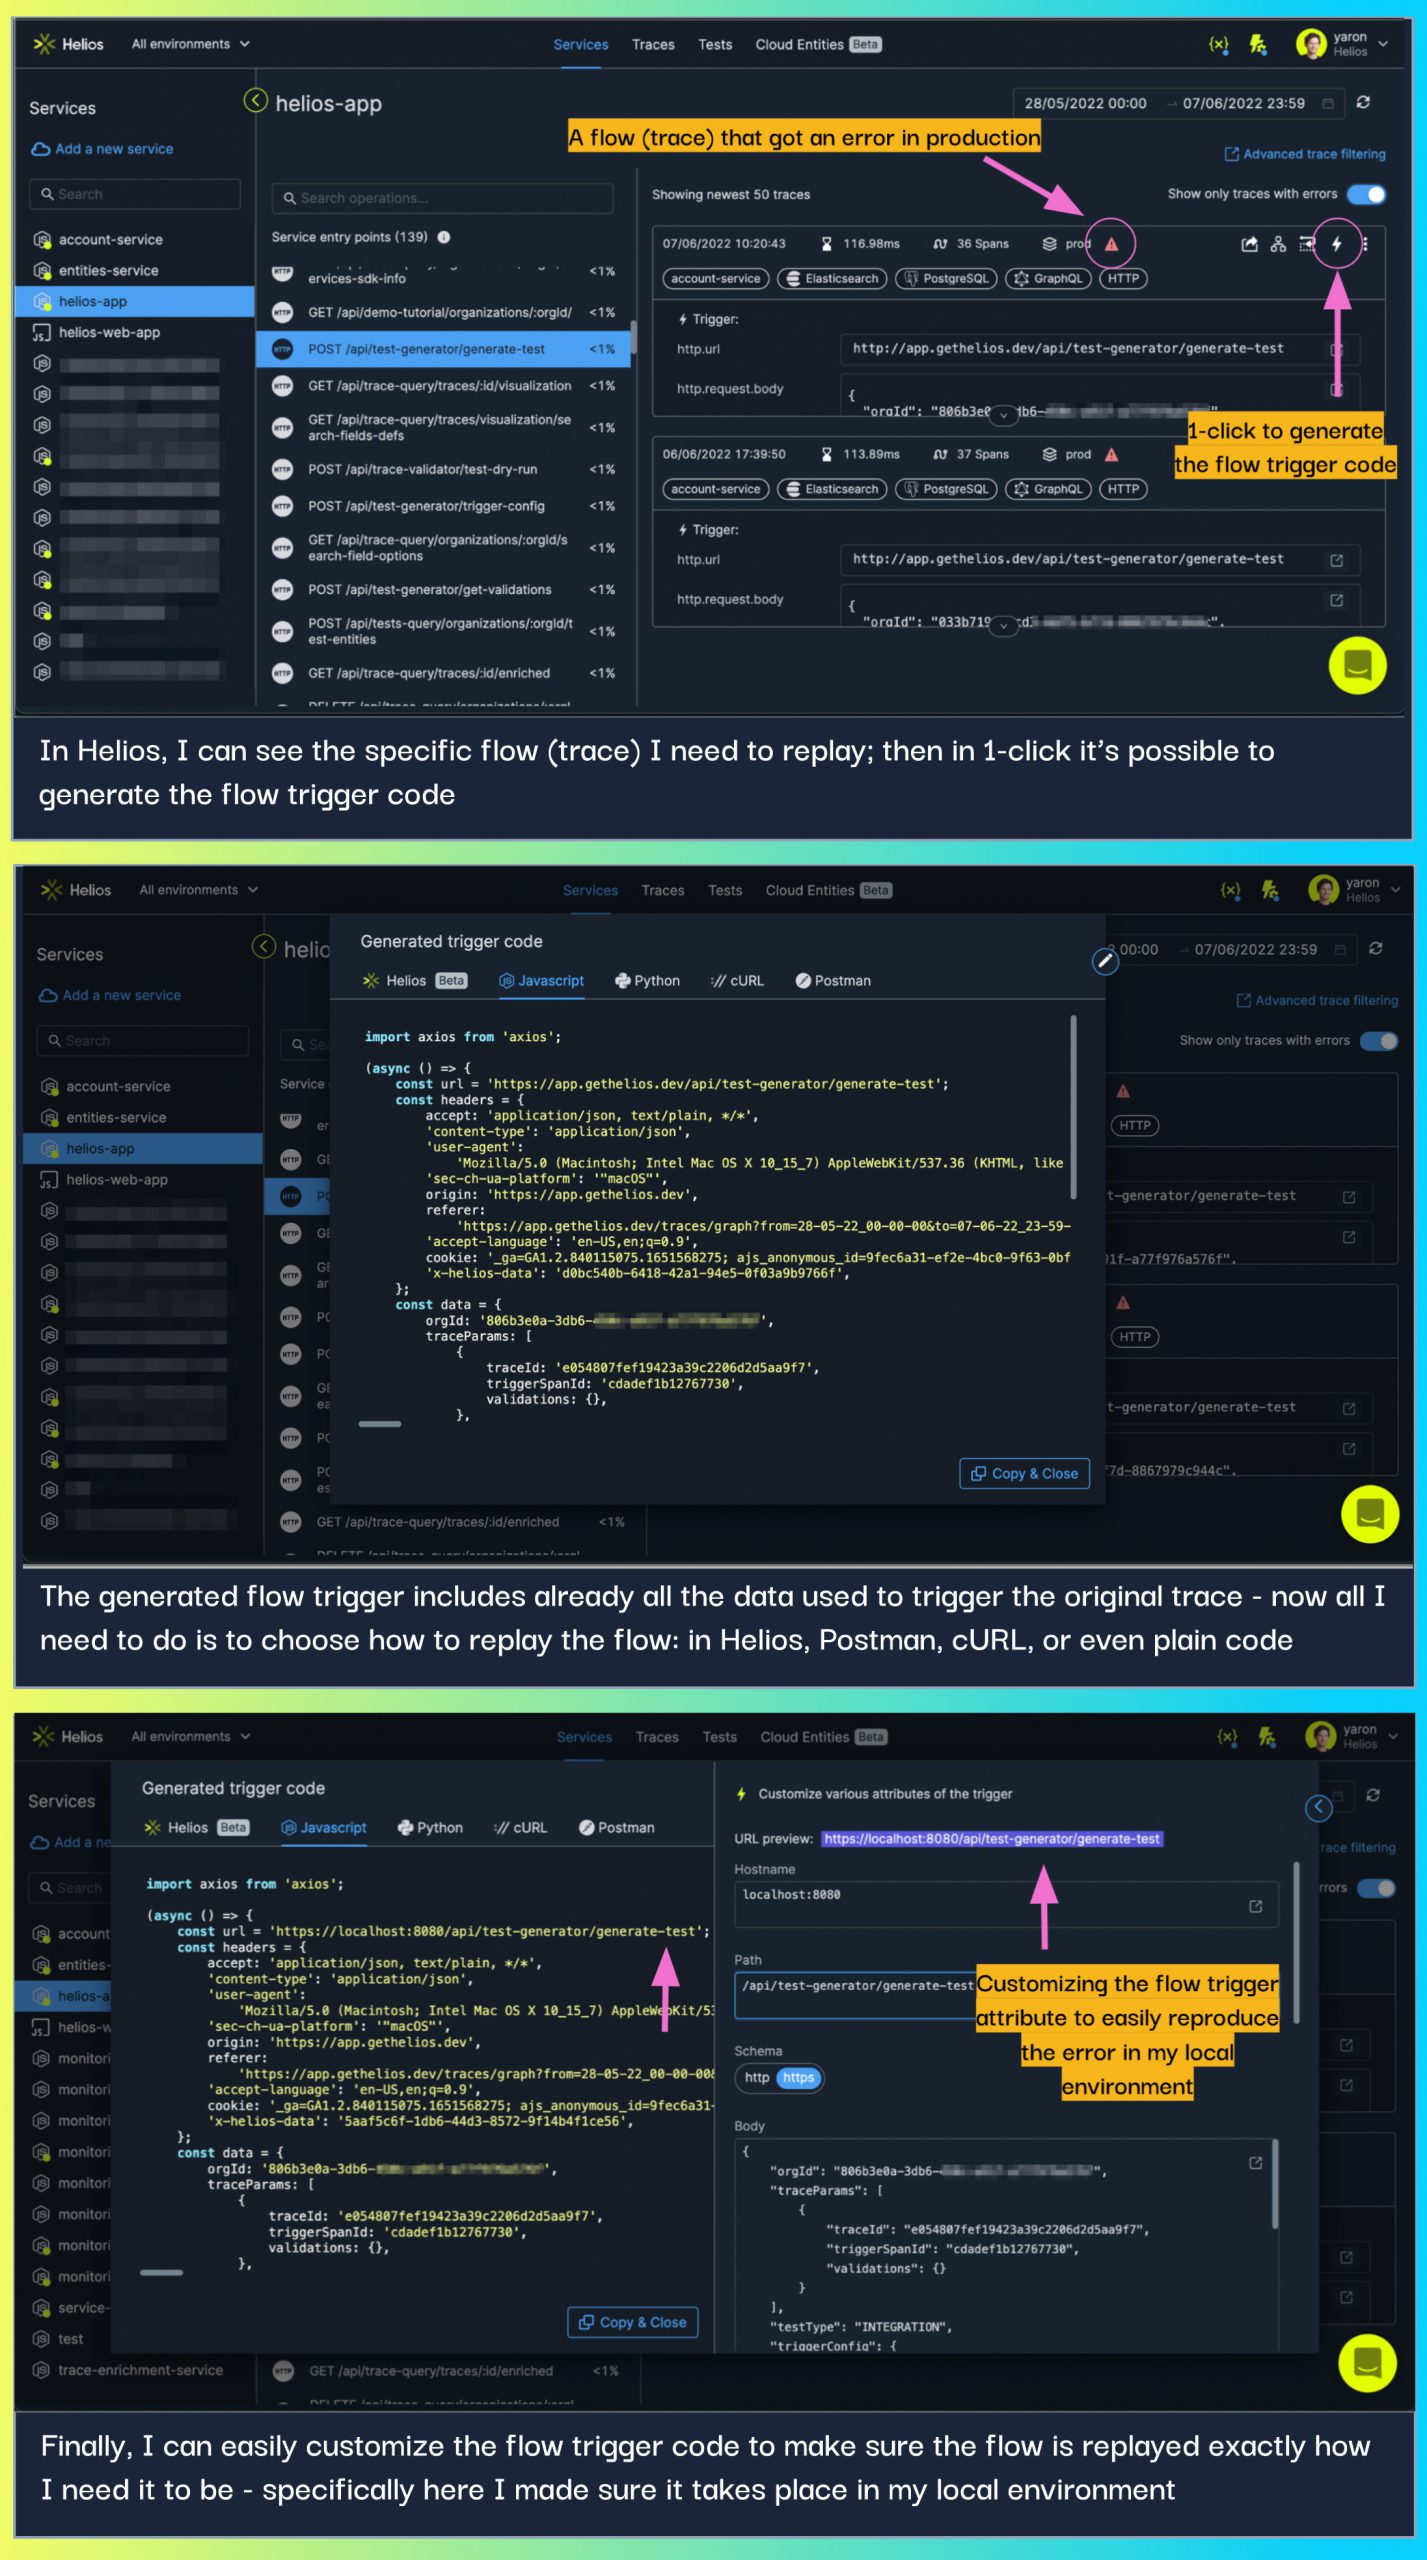
Let’s say you work on a new feature and see some calls that don’t work. After you find the problem and fix it, you want to be sure that those calls that didn’t work in a previous version of the application, now do work. The easiest way to do this is to go to the failed calls and generate the flow trigger code in Helios. You get all the parameters, headers, and the specific payload, enabling you to reproduce the calls. From there, you can run it as a code script, a cURL command, or a Postman request.
The process of reproducing a call from an existing trace used to be difficult. First, you didn’t have the payload anywhere. Even if you had logs, you probably didn’t have headers, so it was difficult to see exactly what went through and what caused the call to fail. You would have to go and find the endpoint, try to think about what the request body is, pull out a token from somewhere – making the entire process complicated and cumbersome.
Even today, replaying calls that are not HTTP is not a simple task. For example, if you wanted to send a message to Kafka in your local environment, you’d need to set up a service that communicates with Kafka. At Helios, we clear the noise around this redundant setup so you can focus on a specific point in the application.
How do 1-click flow replays help me save time on a daily basis?
There could be many use cases for replaying flows. I’ll elaborate on the most recent ones I’ve used when building Helios itself (i.e. dogfooding by using Helios flow replays to make Helios better):
When investigating a bug:
The first thing you have to do when handling a bug is to reproduce it – which can sometimes be challenging if we are working in a distributed environment where many services are talking to each other. Flow replays can come in handy here: you can find the exact calls that caused the bug and generate the code that has the exact same parameters that were sent with the original call. You can run it in your local environment or staging environment in order to reproduce the calls and investigate what exactly is causing the bug.
While working on a fix for the bug, you’re also able to customize all of the parameters of the generated flow trigger code. So, if you move from a production environment to a local one, then you can, from within Helios, change the URL and run it on your local environment with the same parameters.
When building a new feature:
Let’s say during development you want to enhance or change an existing flow. You can use the flow trigger code generated in Helios from a previous call to make sure everything works as expected. As mentioned before, you can also change its different parameters in order to test out edge cases.
These calls are doable using Postman or cURL in the case of an HTTP request – even though you still need to do some intensive legwork to build them correctly with the right data – but what if our triggering endpoint for a certain service was a Kafka consumer or a Lambda function, calls that are not reproducible by Postman or cURL? Previously, we had to work harder to set up these calls. Today, we’re using Helios to replay flows for all kinds of entry points, allowing us to focus on development without worrying about finding ways to start our flows.
For example, I had to enhance a flow which involves a couple of services and is initially triggered by a Kafka message. Using Helios, I easily found an example Kafka message which triggers this specific flow, generated the flow trigger code from it and just changed the Kafka broker address to point to my local Kafka broker. This way, I was able to test my new code with real payloads from our production and saw that everything was working as expected.

* * *
Helios exposes OTel to users with an easy-to-install SDK which collects all the data together with the requests and response payloads. It’s important to note that not every organization with OTel deployed on its services will be able to replay flows with a single click. This collection of the data done by the Helios SDK allows you to reproduce almost every call and flow in the system. Besides the payloads, the collected spans attributes contain all the data – whether it’s the URL, Kafka topic, or headers – necessary to generate code in Javascript or Python, a snippet for Postman, or a cURL call. The flow trigger code is built using the data Helios collected, and without any intervention from the user – although users can always change the different parameters.
Wrap up
Helios is a platform built for developers by developers, focusing on helping them approach issues in their distributed applications and speed up their development lifecycle. In my day-to-day work, I find flow replays to be useful for troubleshooting and reproducing issues, and also in my development process when I want to make calls to certain endpoints using the generated flow trigger code from Helios. Using flow replays is easy and allows me to move faster so that I can be more productive and enjoy what I’m doing at the same time.
Get started with Helios here.


