


Trace Visualization: Understanding is a Level Up from Seeing
It’s common in our everyday language to conflate seeing and understanding when the two are actually very different things. For example, if every day for the last few years we spoke briefly and wrote down the total number of Covid cases in the world, it would be easy to see some trends in the data—you would see the data. But if we present the same data drawn as a chart, it’s easy to understand where the spikes and dips are and when the situation got really bad. This is part of why news sources are sharing this information on a graph rather than just a long string of numbers (what we call trace visualization).
A more stark example comes from driving. If you’re like me you’ve made mistakes following road signs sometimes—particularly in new cities where you’re unfamiliar with the roads and traffic. I have, on more than one occasion I’m afraid to say, turned the wrong direction down a one way road. Sometimes I’ll even see the sign that tells me I’m going the wrong direction and not process it quickly enough. But when I see a truck barrelling towards me at full speed, I understand VERY quickly that I’m going the wrong way.
In both of these examples seeing is helpful, but understanding is another level up. Seeing in a way that drives understanding means we can process the information at a deeper level, and in many cases, much much faster.
Showing vs. Visualizing
When it comes to the kind of data the Helios ingests and processes, the seeing and understanding are directly tied to a difference between showing and visualizing.
We can show you data about a trace in a format that many other software tools do and it will look sometime like this:
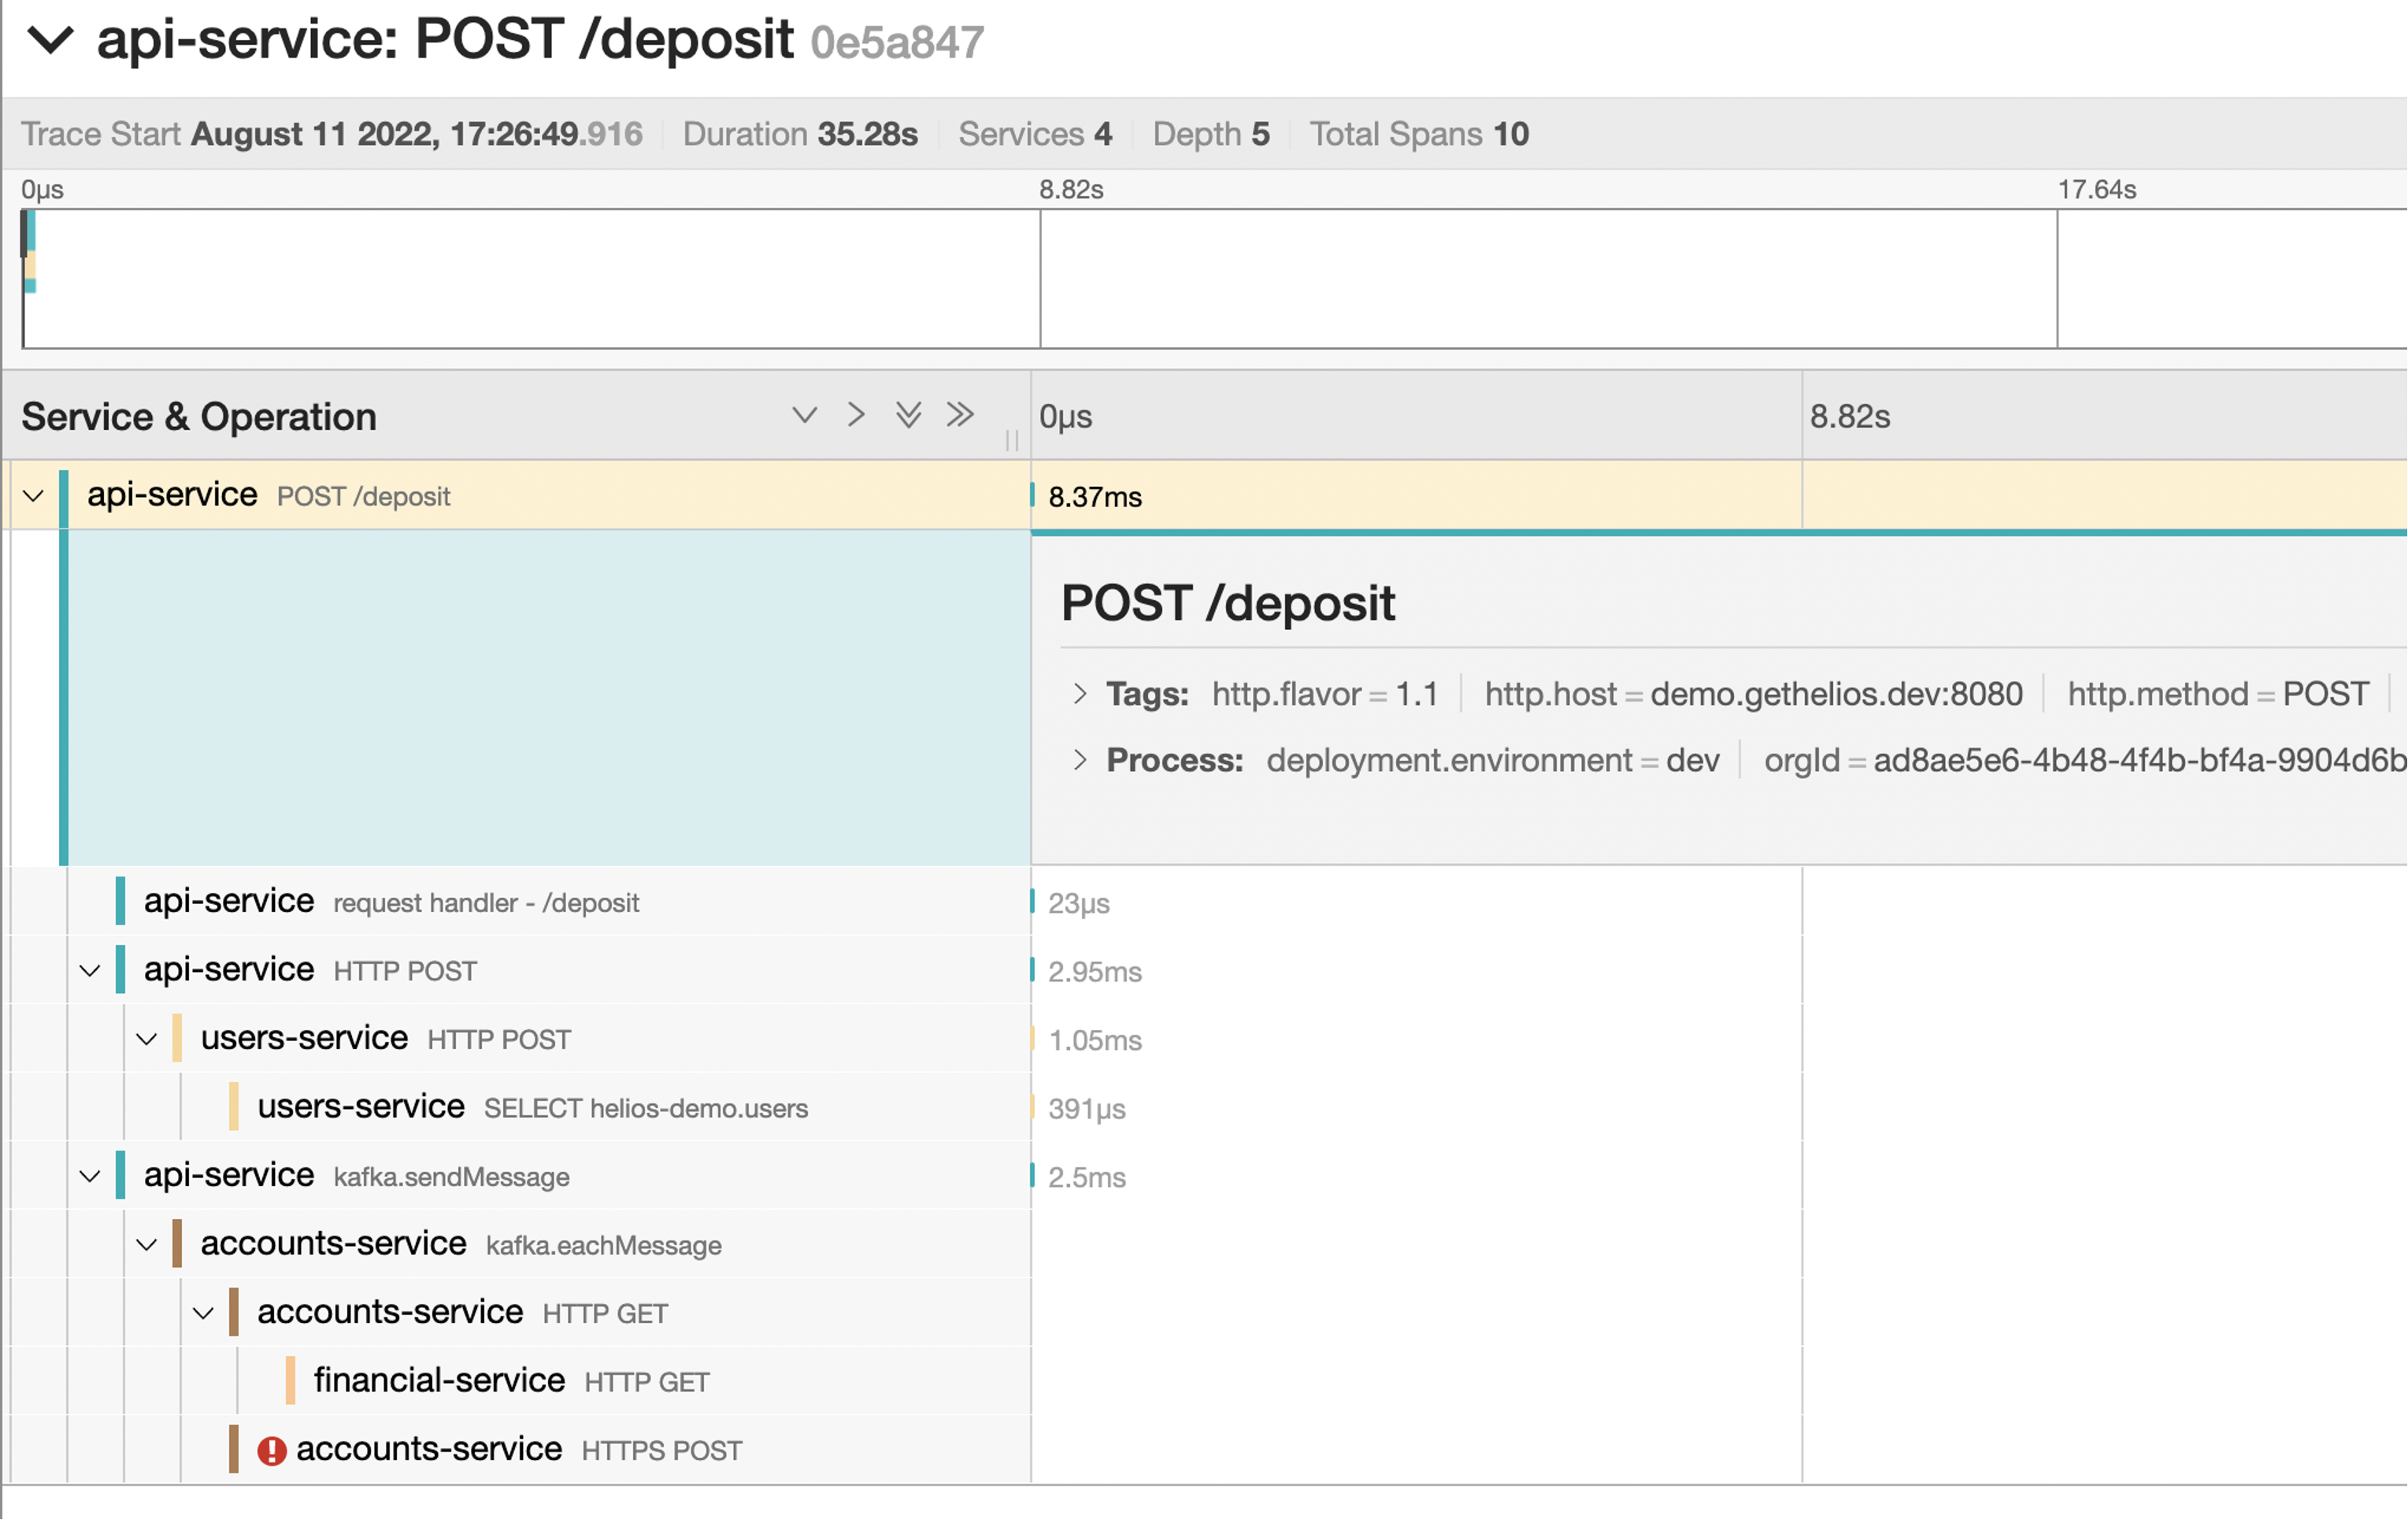
This is akin to the above example with Covid data. Nothing about this data is wrong. It shows you what you need to know. However when you present the same information in a way a person can quickly visualize then you get something more like this:
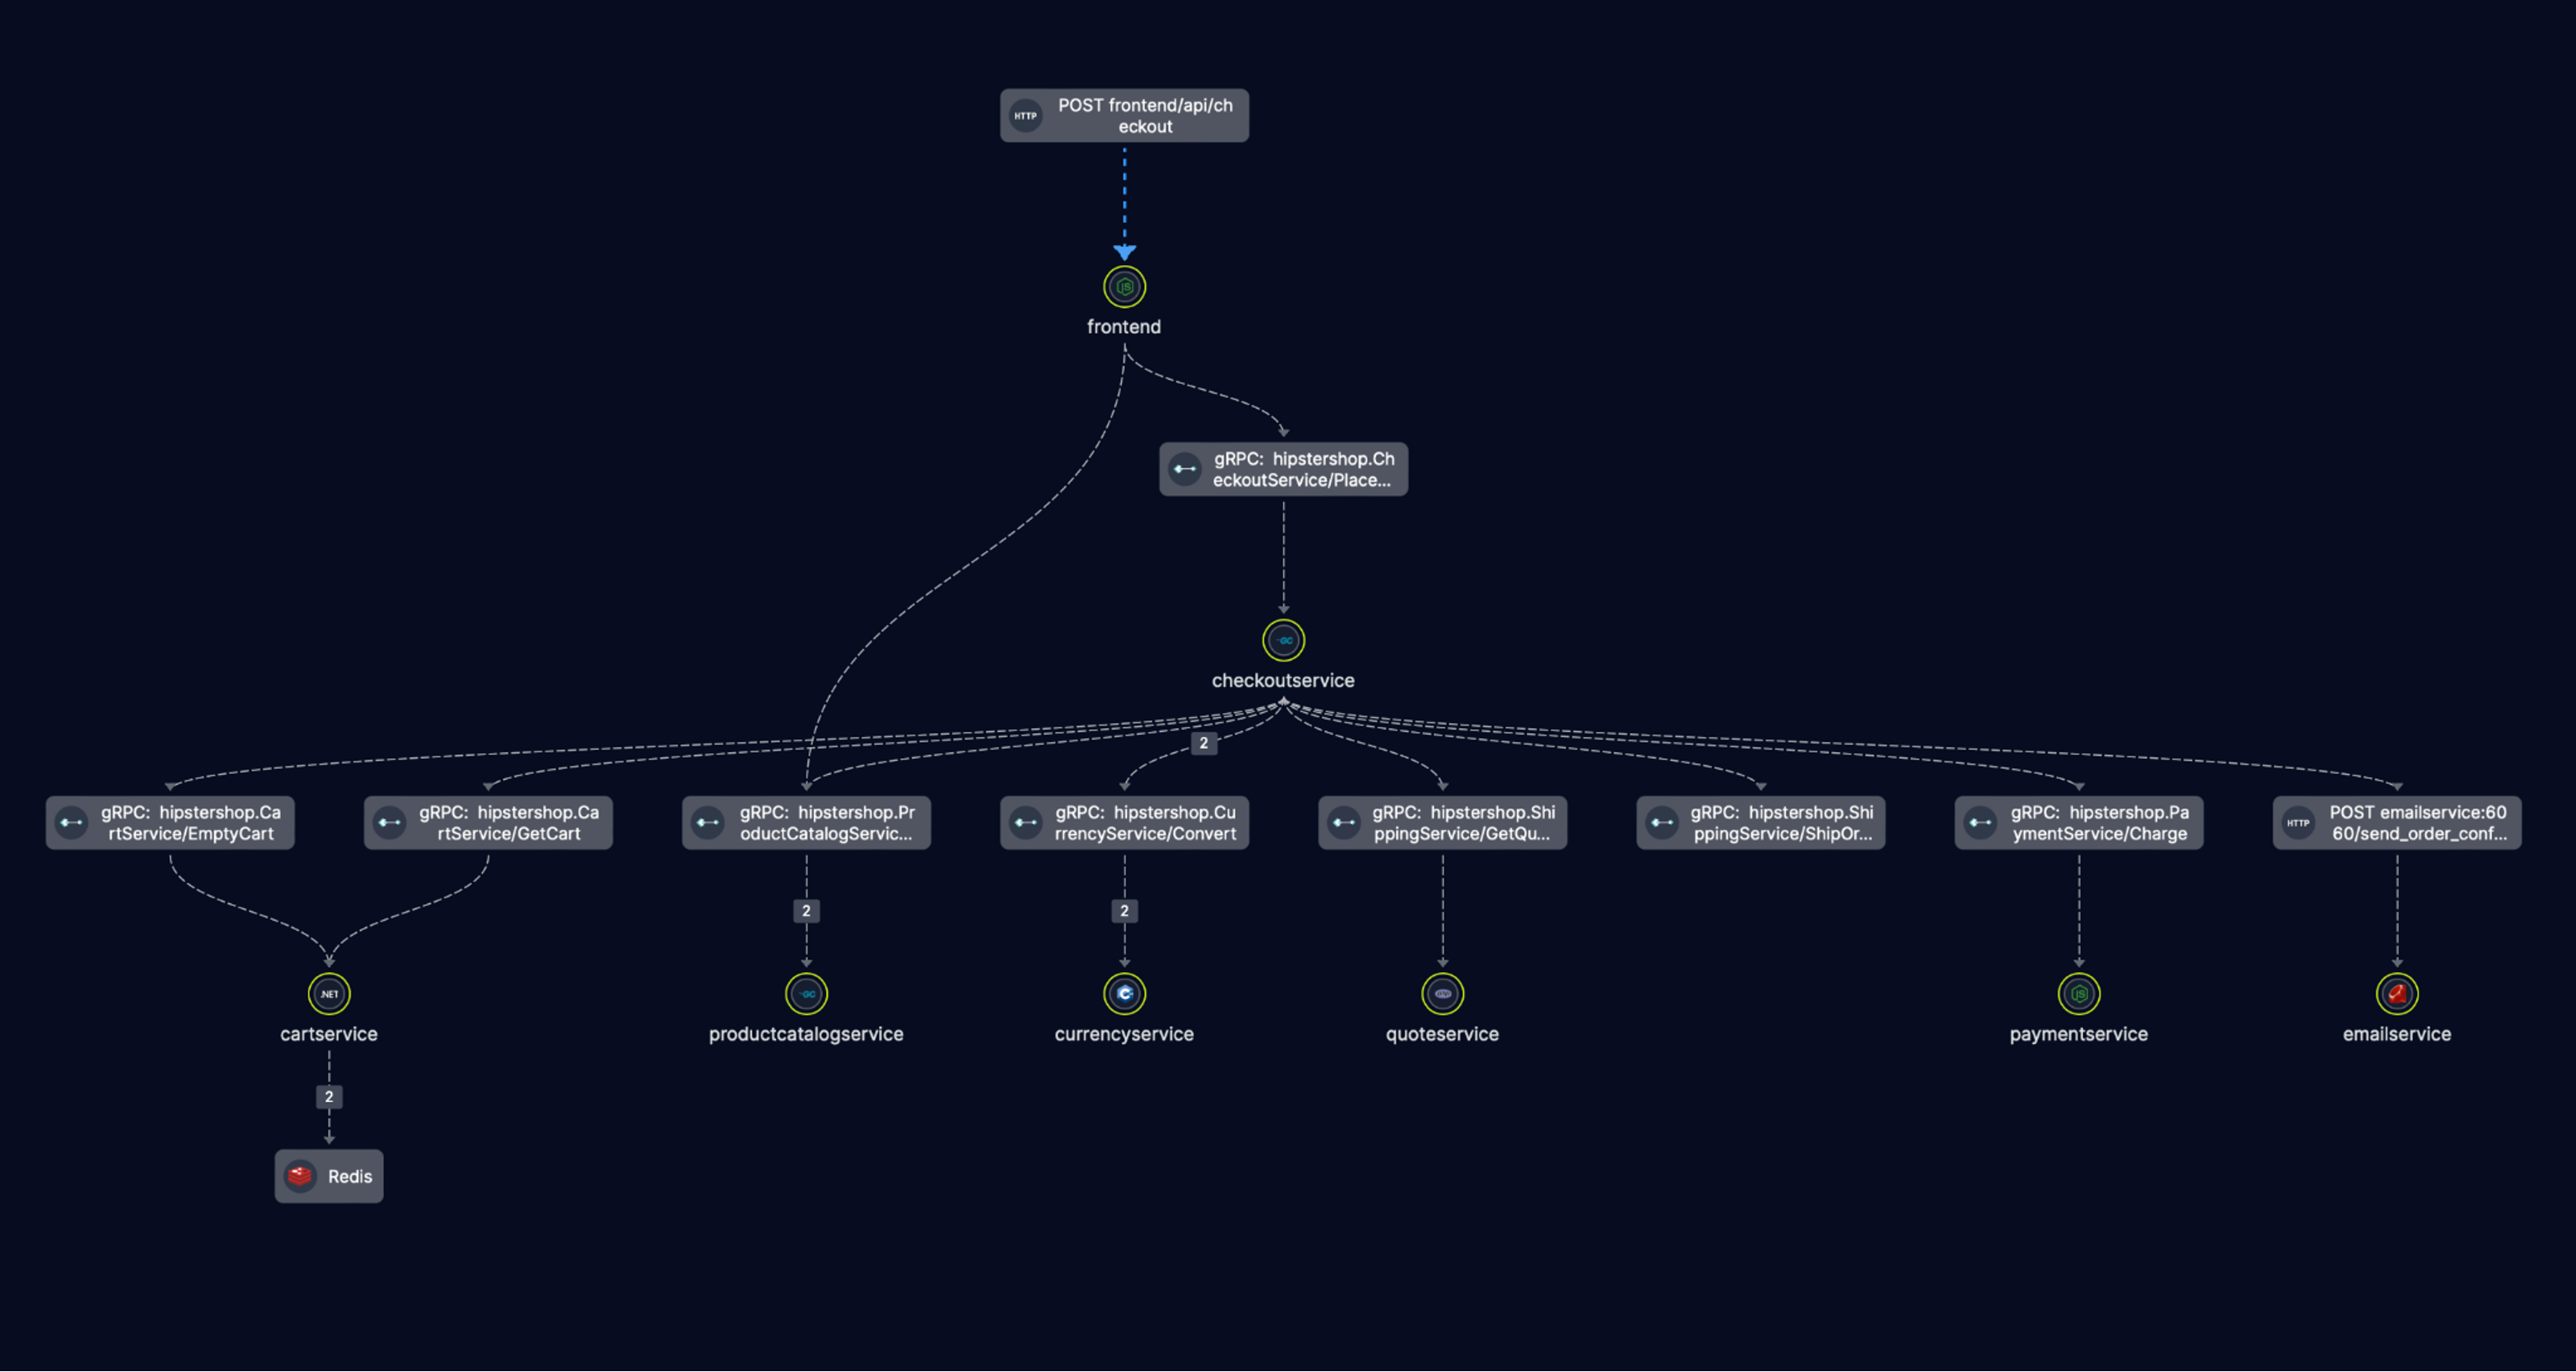
(This trace is a visualization of the open source Open Telemetry Demo)
A great visualization leads to quick understanding.
The above image, for example, presents a lot of information you might otherwise take much longer to find and understand. The first thing you’ll notice is that there was a call to Stripe where an error occurred. Where many developers might start digging through logs every step of the way to see where things succeeded and where the issue arose, this visualization makes it immediately obvious both where the issue was, and where the issue was not. But from this chart, you know you made it past the database call, and through Kafka, and that your interaction over the exchange rate worked as intended, with a simple glance. All of this is part of the power of visualization. With a simple click, Helios can show you the payload collected every step of the way as well as the error message so you can understand the issue and what to do next.
Helios offers troubleshooting features and even the ability to auto-generate tests. But the point of this article is just the power of the visualization itself—this is one of the key bits of secret sauce for Helios.
Trace Visualization as a Fast Track to Troubleshooting
A few months ago I was speaking with a friend of mine who leads a large engineering organization in ed-tech. He told me he was talking to one of his development teams who had expressed that they ran into an issue in one of their microservices. When he asked the team what the problem was, they did not yet know. They had started the investigation but had to dig through logs and retrace steps in a very manual way to find the problem.
This organization, like many organizations, may have a tool in place to track logs or even have a way to leverage tracing to understand problems when they arise in their infrastructure or development process. What Helios does differently is present the information in a way that leads to quick understanding, thus speeding up the process for troubleshooting.
Helios leverages OpenTelemetry to present information regardless of whether you’ve appropriately written log output and makes it so that when you see a trace visualized in Helios you will immediately know where the problem is. It also enables your teams to dig into specifics like “What was the payload that was sent when this particular bit of the trace failed?”. You can then leverage the platform to re-run that trace and see if you can fix the issue (Helios will even generate tests for you to keep it from happening again).
Don’t Just See, Understand with Helios
Helios exists because the tools that were created for developers to write code today haven’t kept up with the changes in cloud native development. Helios distributed tracing and troubleshooting software will enable your teams working with distributed architectures to develop, visualize, understand, and then troubleshoot and ship more robust software—faster. Try us now.


