

Developers can now experience hands-on the combined value of OTel and Helios when building distributed applications with this OTel community demo
OpenTelemetry (OTel), the emerging industry standard for collecting observability data, recently announced the GA of its demo application – and this is good news for distributed tracing fans. Developers can now get a good glimpse of the value OTel provides in a typical microservices-based application and compare the features that different backends (OTel vendors) deliver in terms of shifting observability capabilities “left” toward the needs of developers: visualization, search, alerting, collaboration, and more.
Even more exciting news for devs: Helios has become an official member of the OTel demo repository. We’ve created a free, dedicated sandbox environment for the OTel demo application where you can explore our differentiated distributed tracing offering for yourself. We also prepared this OTel community demo of course.
What’s in it for you? This OTel community demo demonstrated how Helios combined with OTel offers several easily-accessible capabilities to mitigate many of the typical challenges of moving to and building in microservices-based, distributed architectures. This ultimately helps boost developer velocity across troubleshooting, testing, design and collaboration, in all environments. Dev teams can easily and quickly perform tasks such as getting a full view of their API inventory, reproducing failures, automatically generating tests, and collaborating with teammates. With Helios and OTel, you don’t have to go through the hassle of building a demo yourself. Our Helios OTel Sandbox is available and free for all to play with.
Below, we take a look at some of the capabilities.
E2E trace visualization
Some products offer a timeline-based trace visualization view only. It can be complex and messy to understand what you’re looking at. With Helios, you get an organized and beautiful integrated view of your system across microservices, serverless functions, databases, and 3rd party APIs.
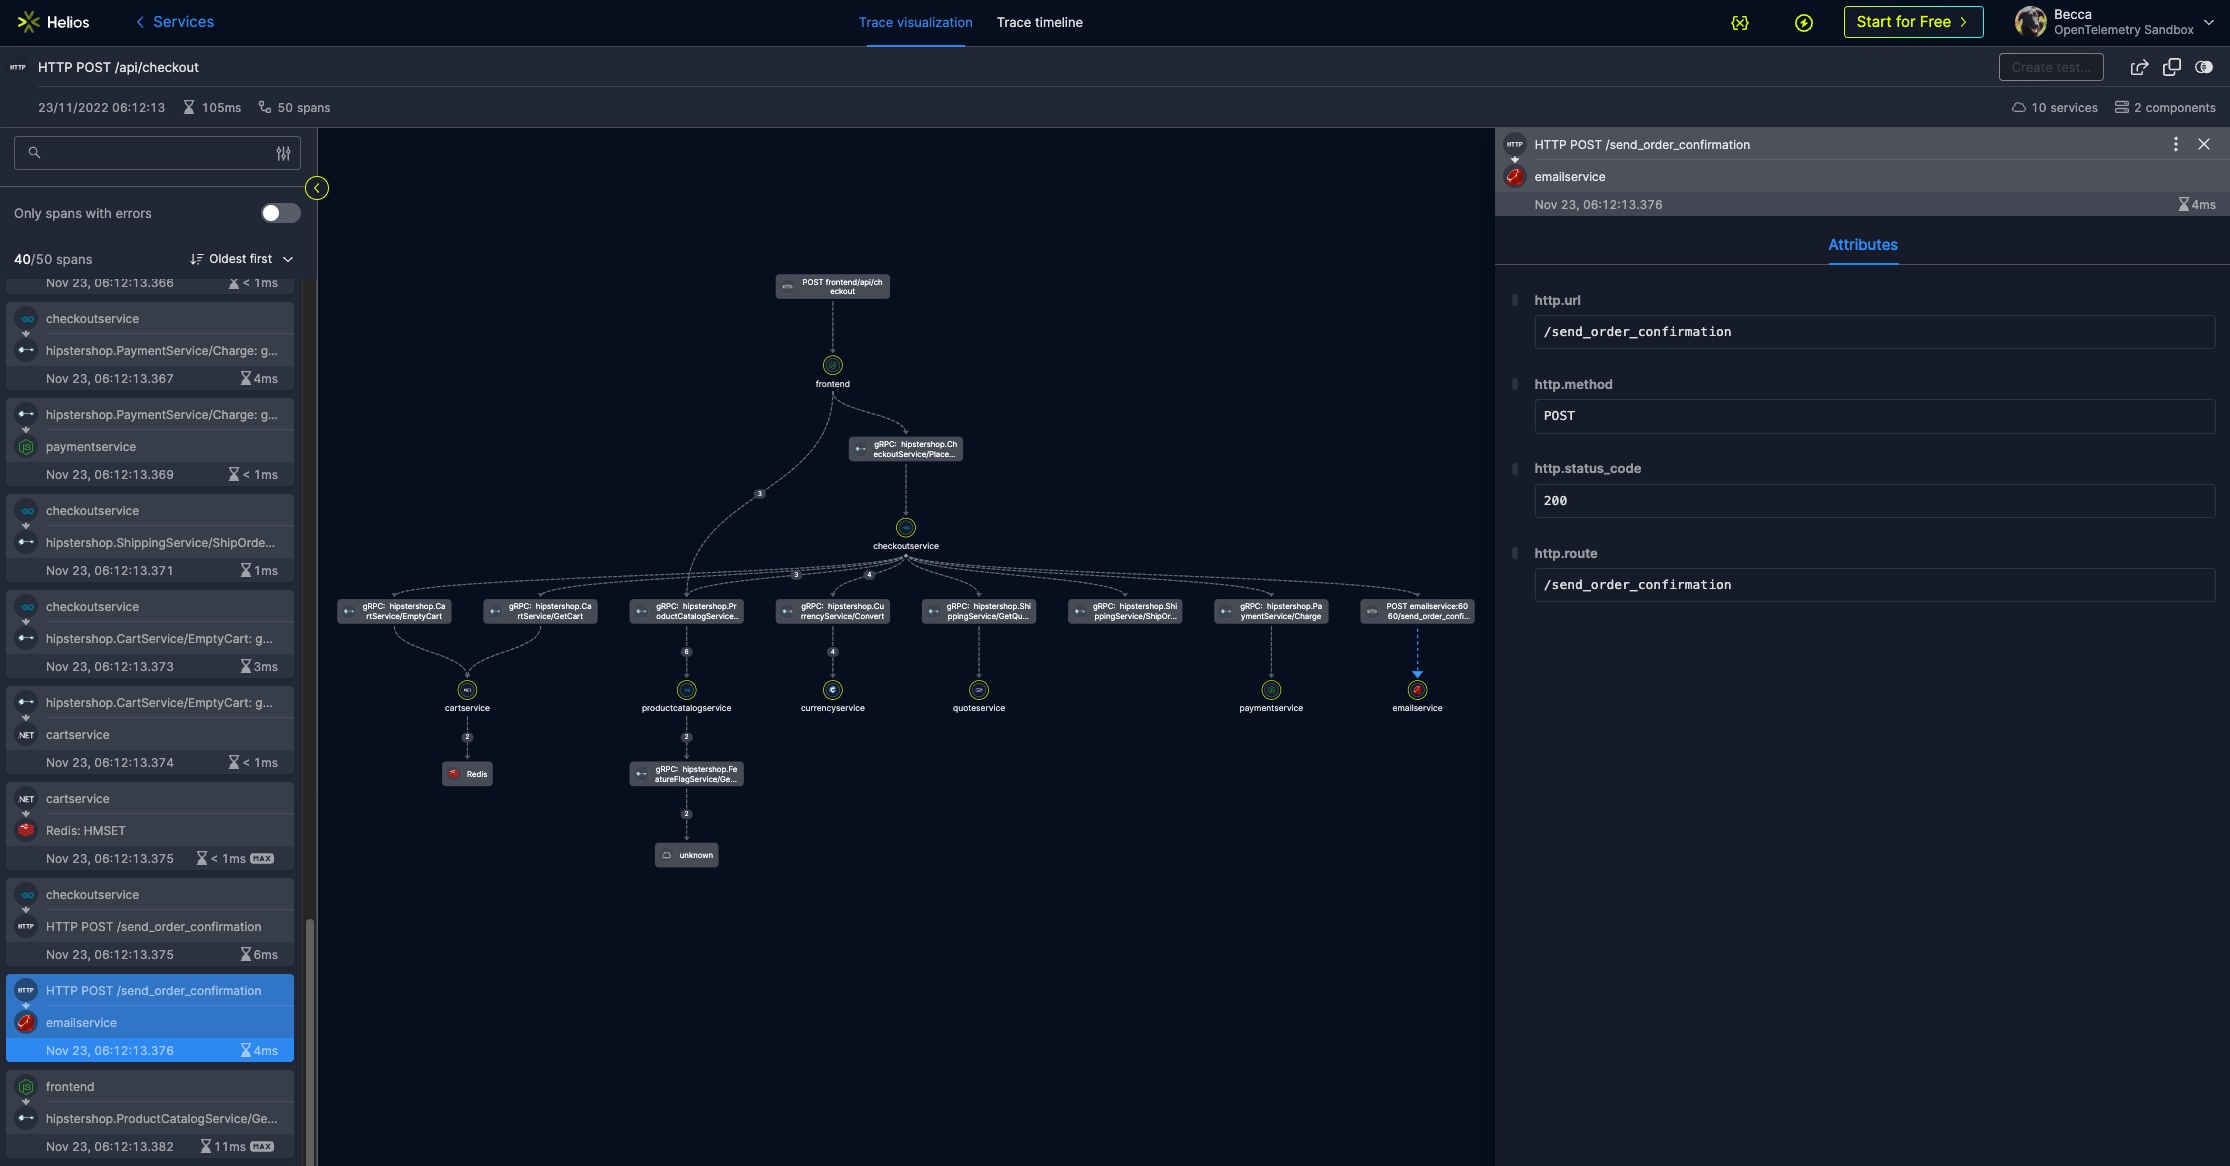
This visibility gives insight into the relationship and dependencies between the different components in your application and enables you to detect changes across versions by tracking traces over a period of time and different environments.
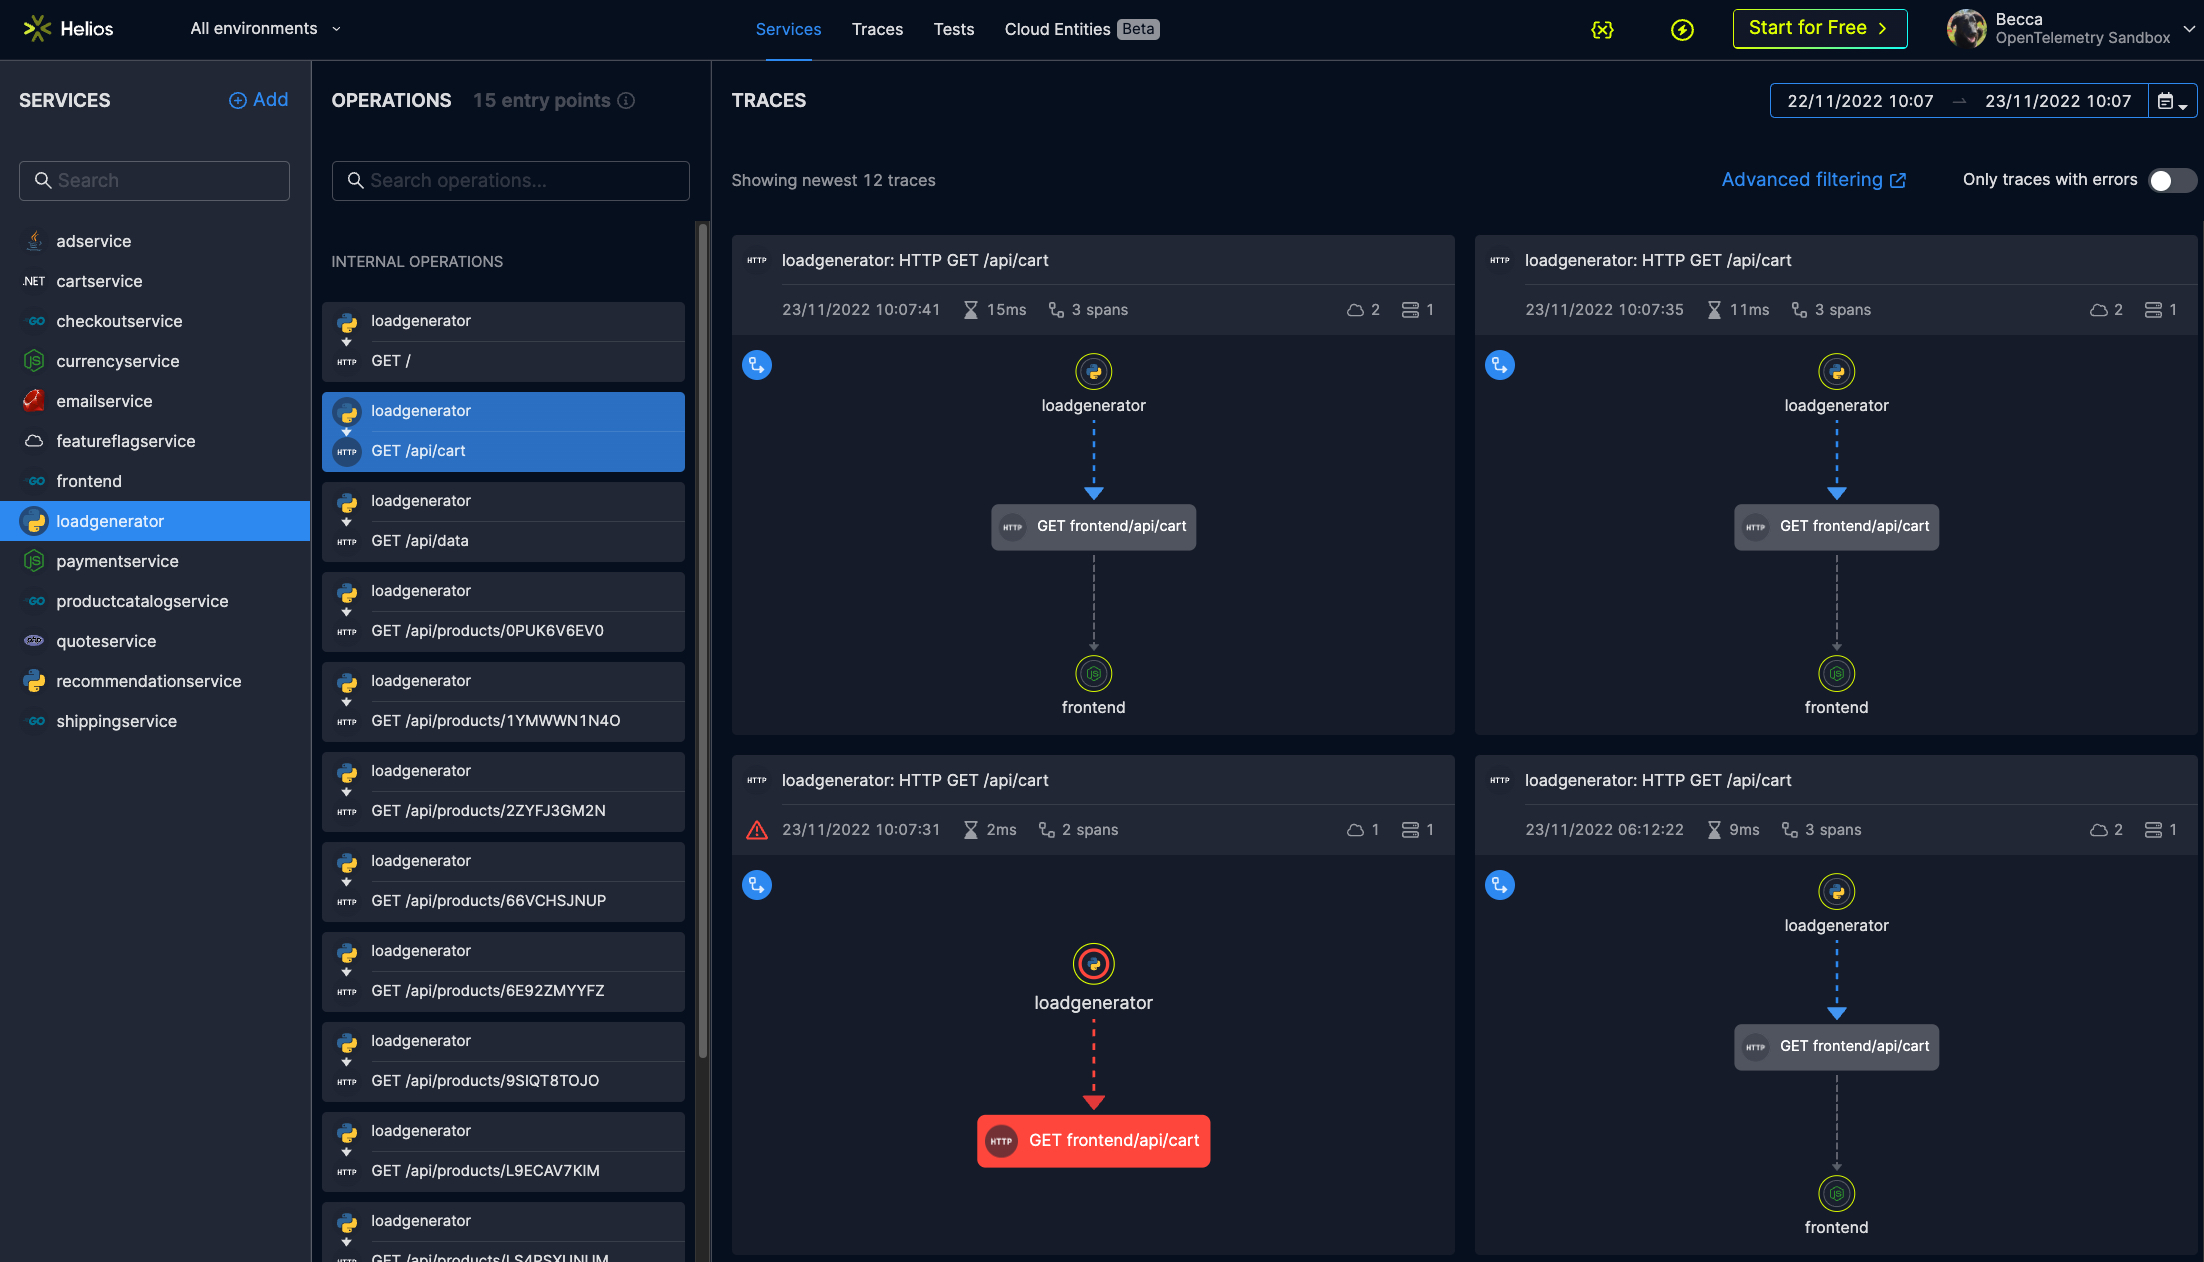
Full view of API catalog
Helios supports different types of APIs including HTTP, gRPC, GraphQL, and also Kafka, RabbitMQ, serverless and more, and you can see a full view of all the APIs that your services expose. We generate an E2E picture that enables you to easily understand the behavior of your service and its downstream and upstream dependencies.
Extensive search capabilities
Troubleshooting can be a tedious task, but Helios offers tools to help streamline your debugging process. You can filter errors by service, API calls, message queues, and streams with highly-granular search capabilities. We enable filtering by the standard OTel semantic convention attributes.
Team collaboration tools
Helios makes collaborating with teams and building features easier than ever by enabling devs to share traces, tests, and triggers with others. Devs can build and edit tests together and give visibility to each other into local environments. Additionally, Helios integrates into a developer’s existing ecosystem, such as observability tools, error monitoring, JIRA, testing frameworks, Slack, and more, increasing synergy between and across tools.
* * *
We invite you to explore the above features in our open Helios OTel Sandbox. We offer even more capabilities when using the Helios SDK in various languages. For example, you can get access to payloads (HTTP request and response bodies, message queues content, and DB queries and results) enabling you to understand how your flows progress through a distributed application. You can also reproduce flows, including HTTP requests, Kafka and RabbitMQ messages, and Lambda invocations in just a couple of clicks.
Get started with the OTel community demo and Helios
- Go to https://app.gethelios.dev/signup and create a free Helios account
- Get your Helios token from the Helios app under Settings > General
- Fork the OpenTelemetry community demo repository into your own Github workspace
- Edit the
otel-config.ymlinsidesrc/otelcollector, and add the following config under exporters:otlphttp: endpoint: "https://collector.heliosphere.io" traces_endpoint: "https://collector.heliosphere.io/traces" headers: Authorization: "YOUR_HELIOS_TOKEN" - Finally, add the
otlphttpexporter to the exporters list underservice / pipelines / exporters


