

One of the things that most excites me about what we at Helios are doing differently than anyone else is trace visualizations. While there are many ways to troubleshoot microservice architectures, a good visual overview goes a really long way to speeding up understanding and therefore accelerating time to a resolution. When your manager asks, “Why did that break down?” with Helios you can answer quickly with accurate data—this is the value of the Helios platform.
The first thing I did when I started here was show friends what we were building and get feedback on it. So just a few weeks in I was excited to be sitting with a senior engineer friend of mine and showing him something like this:
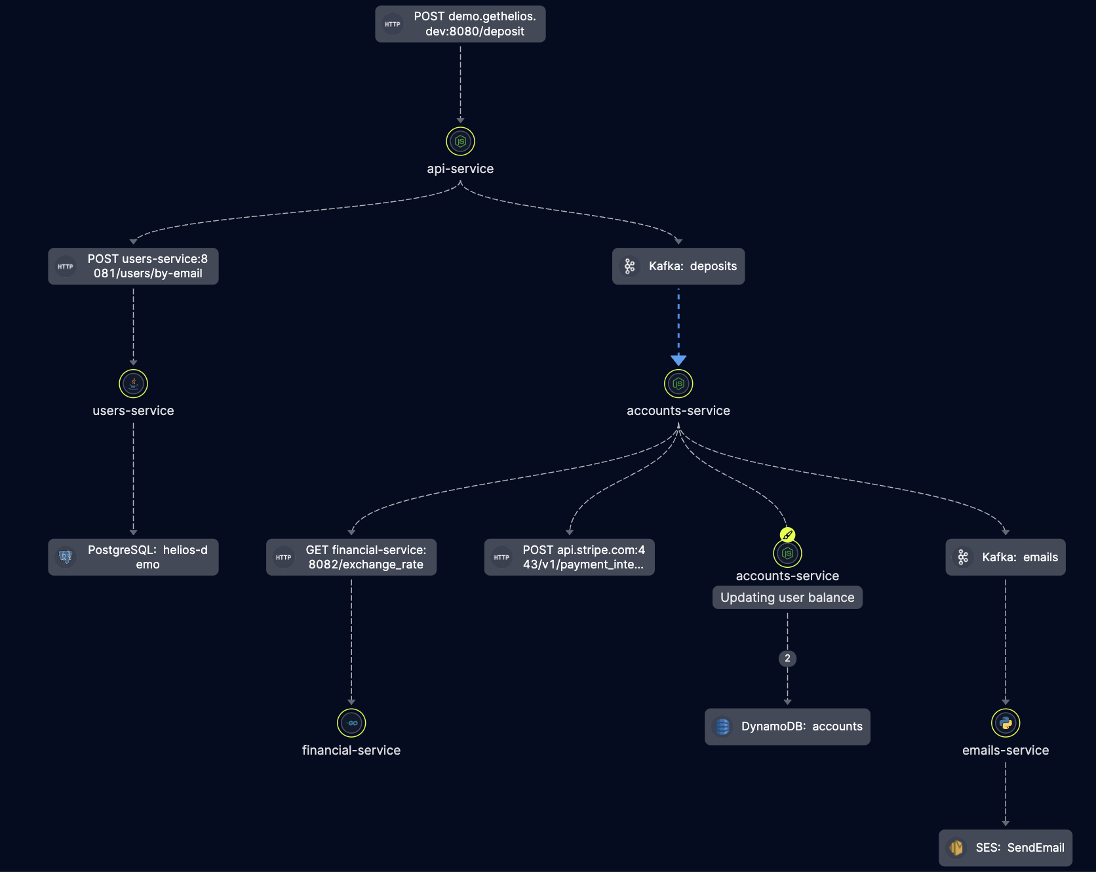
The Peculiarities of GraphQL Traces Visualized
While my friend was impressed with what he saw, (and the fact that we’re collecting the payloads for every span in this trace), he asked me how we handle GraphQL given that his company’s architecture leans on it so heavily. We did have support for GraphQL but he spent a while talking me through the ways a company like his would need something slightly different for a complex use case like theirs.
If you’re unfamiliar with GraphQL, here’s another way to look at it: before GraphQL, when you wanted to know about a single house in a city and everything in it you had to reach out to and query an end-point for dogs, cars, houses, streets, neighborhoods, buildings etc…. GraphQL changes the game in that it gives you one endpoint to query in the city and then as long as you know what you’re looking for (what to include in the query), you can find details about everything in the city, including everything in one specific house.
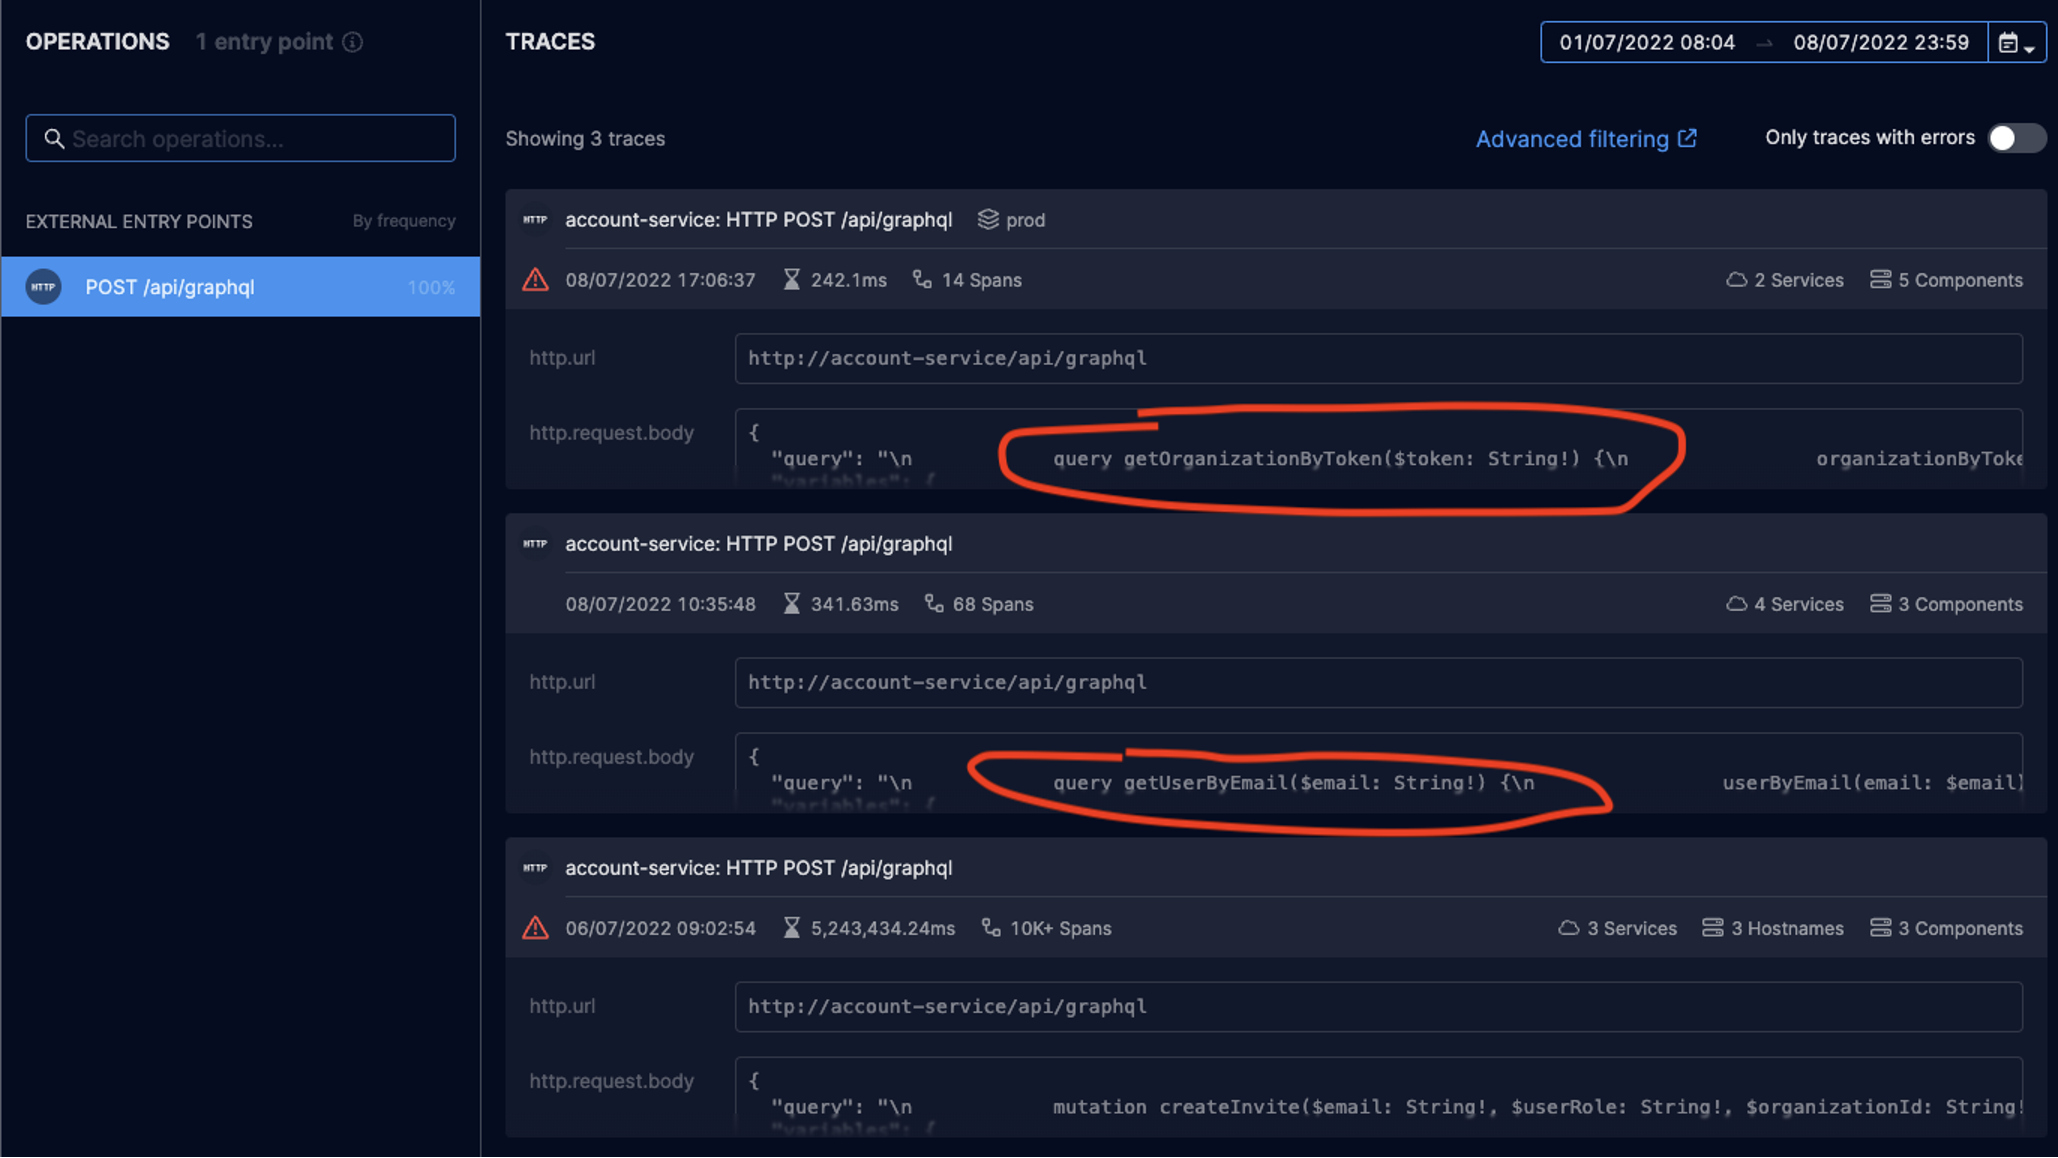
In visualizing what is happening behind the scenes with tracing, this makes a meaningful difference. In RESTful APIs, each API is exposed as a different HTTP endpoint (e.g., GET /api/users, POST /api/organizations), and so browsing through the list of endpoints can usually clearly tell the story of what the API does. GraphQL, however, has a single HTTP endpoint (typically, POST /api/graphql) – and so if the GraphQL endpoint is visualized the same as the HTTP endpoint, it won’t show the depth of what’s happening under the hood.
Implementing GraphQL Query Visualization
The Helios engineering team was able to take this feedback and quickly implement a more granular visualization of GraphQL queries.
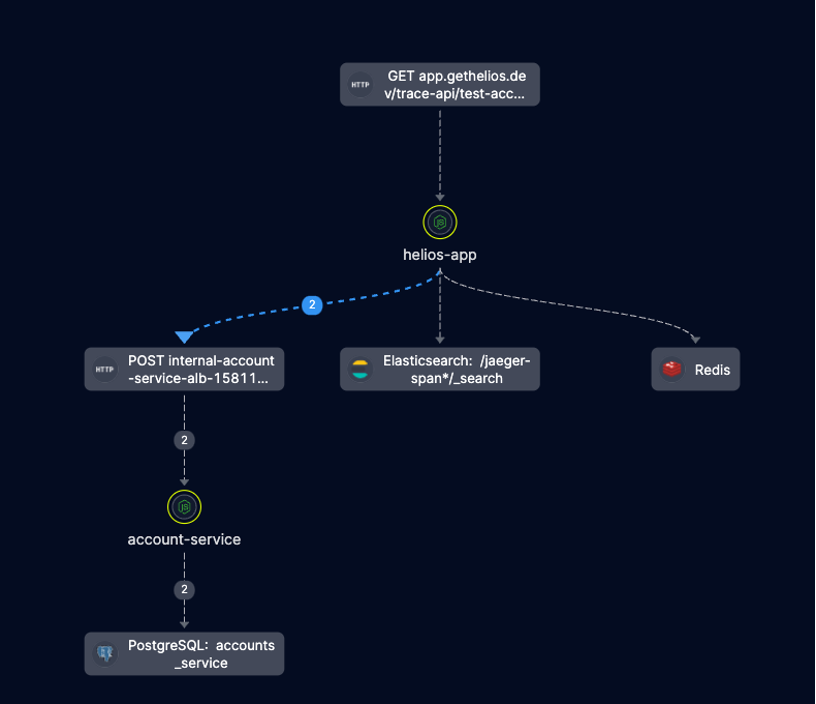
To build this out and group API calls by their endpoint, as shown in the screenshots above and below, we had to make some changes. The Helios backend usually uses a combination of the HTTP method (GET / POST / etc.) and route (e.g., /api/v1/users) but this approach is clearly not helpful in the GraphQL case, since every query will be mapped to the same endpoint (POST /api/graphql) – and distinguishing between totally different queries requires manually going through the HTTP payload.
We found a solution by adding an OpenTelemetry processor to the ingestion pipeline which parses the GraphQL payload and classifies the request according to the query itself.
And today that looks something like this:
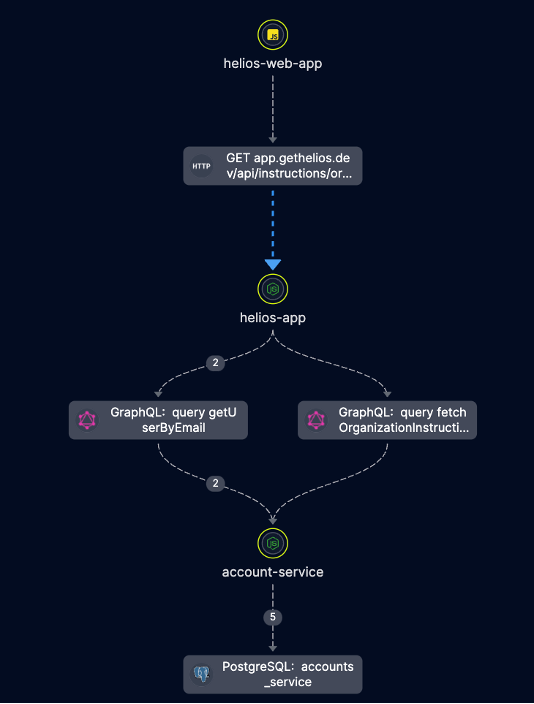
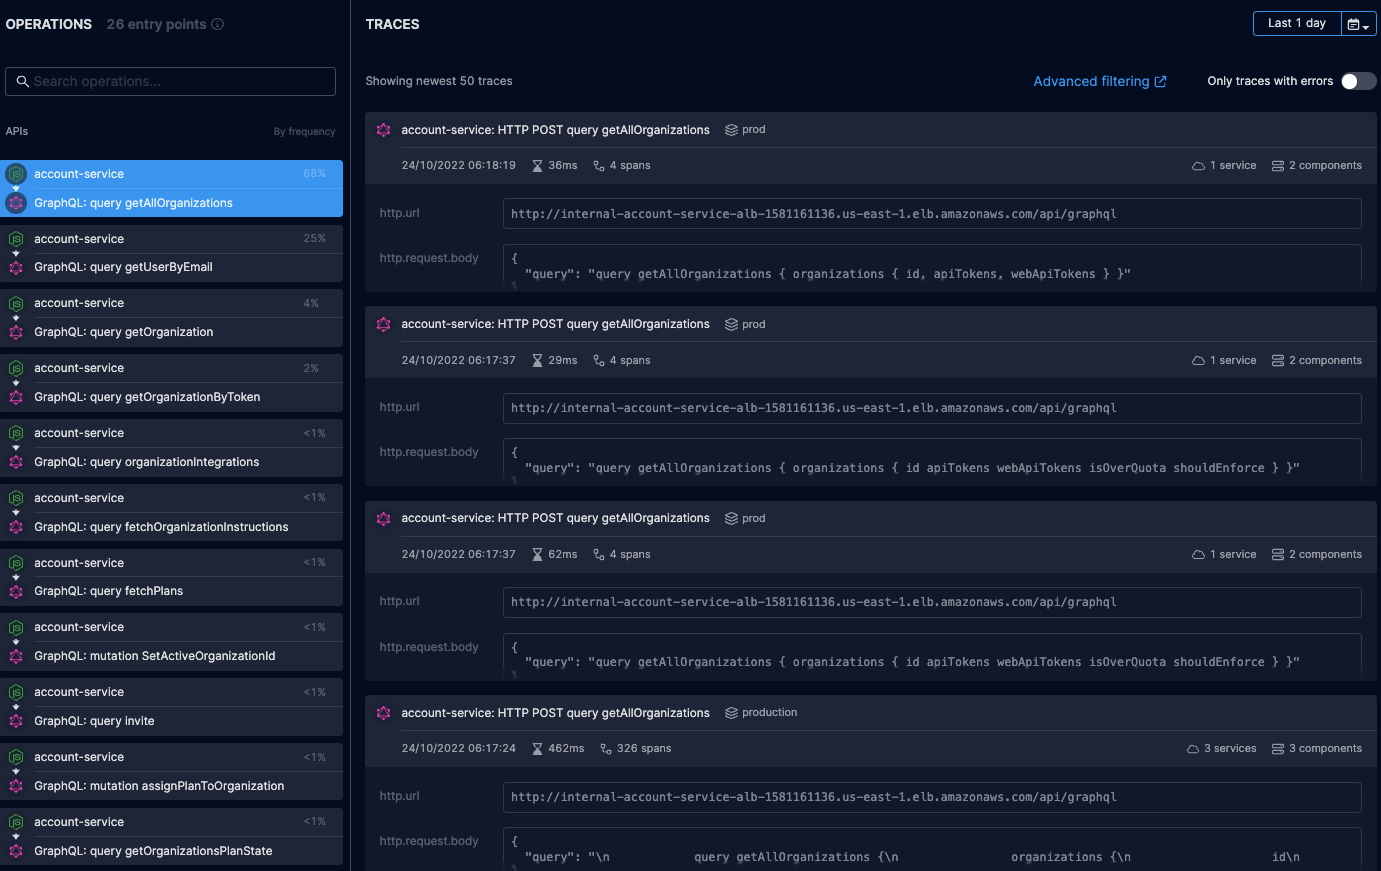
Now when you visualize a GraphQL query in Helios, we will show each type of query with an individual node to make wrapping your head around what’s happening even easier.
We Built Helios to Accelerate Troubleshooting in Microservice Environments
Helios solves the problem every microservices developer will encounter when they execute something and find an error—but aren’t sure where to look for what broke down. The granularity of this kind of visualization means a quick glance at Helios can show them the request that failed, and where in the complex system the error actually arose.
Every day we’re looking for ways to make Helios better, and we’re happy with the feedback we’ve received leading to this change—new GraphQL support will help a wider set of organizations. That said, we’re always looking for ways to improve it (reach out if you have ideas!).
Ready to get started visualizing your own GraphQL architecture with Helios? Sign up and get started today.


