When developers talk about the options OpenTelemetry opens up to them, one of the most powerful use cases is troubleshooting distributed architectures. With OTel data and insights, developers can identify bugs and solve a wide range of issues across various types of architecture and flows. These include asynchronous flows, flows with Lambda functions, and many more. Thanks to OpenTelemetry and complementing solutions, the friction in the troubleshooting process has been reduced and the entire process can be accelerated.
But what about the frontend development? Can OTel help full-stack and front-end developers as well? What options do frontend roles have for leveraging OTel? In this blog post, I will discuss what OTel can provide frontend developers with and how it can accelerate their dev velocity and reduce MTTR.
Why Frontend Troubleshooting
Similar to backend development, the main and most important frontend use case is troubleshooting.
Take a simple e-commerce application architecture with a mobile application, a web server and a database. Now let’s say one of your mobile users reported that the app was getting stuck when clicking the “Purchase” button, precisely when ordering a new dark-themed mechanical keyboard.
As engineers who want to solve this issue – what should we be doing?
In a world without frontend tracing, we lack sufficient information about the issue, since the issue could have occurred in the frontend or the backend, it could have been a latency issue, etc. We could try to collect logs that would shed some light on the issue. But even if they are available, it will be difficult to correlate client side and server side logs. Then, we would probably try to find where the issue is, by reproducing it from the mobile application. This action can take some time and may not even be feasible as we don’t have the conditions on the client side. We need to sign into the app, reproduce the user flow (the keyboard order) and click the same buttons. Hopefully, the issue will then be reproduced.
But what happens when the issue isn’t reproduced? This could happen, for example, if the issue was related to:
- The user’s status
- A communication issue that the app doesn’t know how to handle
- A DB query that messed up on the backend side
We need further information for identifying the specific issue. This is where frontend tracing can be helpful. Frontend tracing enables us to stop guessing and begin understanding where the issue occurred.
Frontend Troubleshooting with Distributed Tracing
Data from tracing is based on spans. If a trace is a collection of operations that represent a transaction, a span is a single operation. It can be an HTTP request, a DB query, a serverless function invocation, etc. By taking the spans and visualizing them in a tree-like manner, developers can see the full and dynamic view of their system, including the issue they’re investigating. Then, they can investigate deeper to understand why it happened and resolve it. A trace can be really helpful when identifying the root cause of an issue, like bottlenecks or latency issues.
Let’s look at an example. Here is a to-do app trace with three simple components – a frontend, backend and MongoDB:
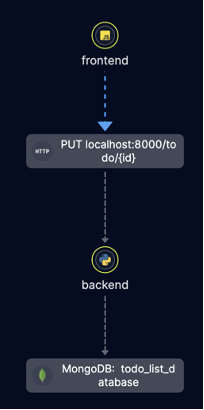
The trace includes spans from the frontend app and the backend service. If an issue occurs, you can see exactly which data flowed between the components. This enables us to “draw the line” from the specific click in the front end (performed by the user) to the DB query.
Now, instead of guessing where the issue was – you can actually see it. You can see if the request left the device, if there was a response from the backend, if there were “missing parts” in the response that caused the app to get stuck, etc.
Now let’s say we want to investigate if an issue was caused by latency. In Helios, we have a feature that shows the duration of a span. It looks like this:
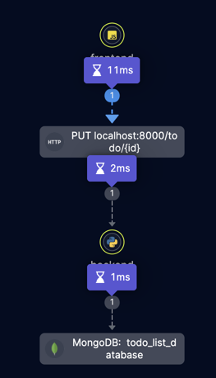
Instead of guessing where the bottleneck is or creating a log-based timestamps report, you can examine the trace itself. The timestamp of each span shows when actions occurred and if there was any latency in the request.
Helios’s spans explorer was designed specifically for this use case. It allows sorting spans based on their duration/timestamp:
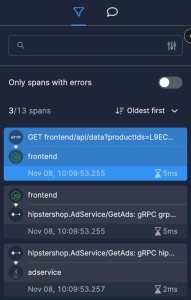
In the trace visualization, we can see how much time each operation takes – and maybe even where we should optimize.
Another great way to examine all the bottlenecks is the default Jaeger view that shows the trace breakdown:

Adding Frontend Instrumentation to Your Traces in OpenTelemetery: Advanced Use Cases
To enhance bottleneck analysis capabilities, it is recommended to add frontend instrumentation to your traces. OTel provides many kinds of SDKs, most of them for backend services. However, code is code, and OTel has an SDK for JS, with more client libraries forthcoming. Let’s see how to add them.
Aggregating Traces
The frontend is a great place for aggregating a few traces together into one large trace comprising multiple requests. For example, let’s think of a purchase flow with three REST requests: one to validate the user is active, one for billing the user and the third for updating the DB.
Now let’s say that we want to see this flow as a whole, in the form of a single trace for all three requests. All we need to do is create a custom span that wraps all three into one flow and that’s it!
Here is a code example that shows how to do it:
const { createCustomSpan } = require('@heliosphere/web-sdk');
const purchaseFunction = () => {
validateUser(user.id);
chargeUser(user.cardToken);
updateDB(user.id);
};
createCustomSpan("purchase", {'id': purchase.id}, purchaseFunction);
Now, all the spans that will be created under the validateUser, chargeUser and updateDB will actually be aggregated under the same trace.
Adding Span Events
Adding data about specific events can be very helpful when troubleshooting and analyzing frontend bottlenecks.OTel provides a functionality that allows developers to add a report about an event and connect it to a specific span. This is called a Span Event.
A Span Event is a human-readable message on a Span that represents a discrete event with no duration and can be tracked by a single time stamp. You can think of it as a primitive log.
It looks like this:
const activeSpan = opentelemetry.trace.getActiveSpan();
activeSpan.addEvent('User clicked Purchase button);
You can use the Span Events for collecting different types of information, like event clicks, device events, networking events and more.
Adding Baggage
Another great OTEL feature that can be helpful on the frontend side is the ability to add Baggage to a trace. Baggage is the contextual information in spans and it makes values available across all spans in a trace. With Baggage, you can propagate attributions across the system to all services.
User data is a key component of frontend development, making it an ideal candidate for transferring it between spans via Baggage. Stripe tokens, user identification data, user preferences like currency, languages, time, and many more can be transferred using Baggage. You can read more about it here.
Deploying Frontend Instrumentation
After adding instrumentation to your traces, the deployment is easy. It is like the deployment of any other OTel SDK.
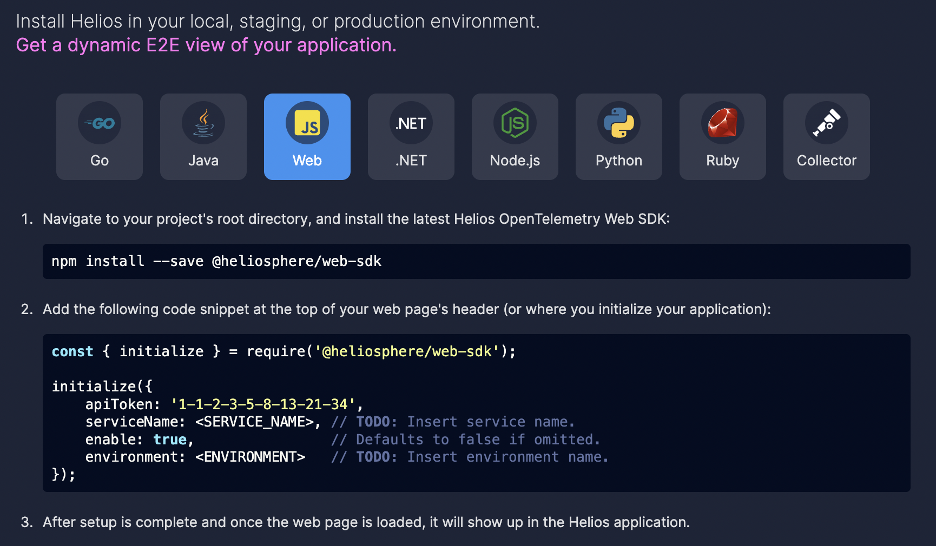
If you want to visualize these additions and gain more insights without having to set up your own infrastructure, you can also use Helios’s SDK. All is needed to do is just go to the Helios website, sign up here, and follow the steps for installing the SDK and adding the code snippet to your application.
This is how the deployment instruction of the Helios frontend SDK looks like:
Next Steps for Frontend Developers
Frontend instrumentation is easy to set up and opens up many new troubleshooting capabilities for frontend and full-stack developers that were previously unavailable to them. The ability to “draw a line” of the transaction, from a click on the UI to a specific DB query or scheduled job, provides new insights that can help identify bottlenecks and analyze issues. OTel and Helios both support frontend instrumentation. Get started today.


