


What is Distributed Tracing?
Distributed tracing is a method of tracking requests as they propagate through a distributed system. A trace is built from spans. Each span represents an interaction, like an HTTP request, a DB query, a serverless function invocation, etc. A trace is essentially a tree of spans.
Based on the collected span data, a distributed tracing platform can capture all the interactions between the different architectural components and tie them together with a trace ID. Then, the various architectural components and the interactions between them can be correlated for different purposes, one of them is visualization in a tree-like manner.
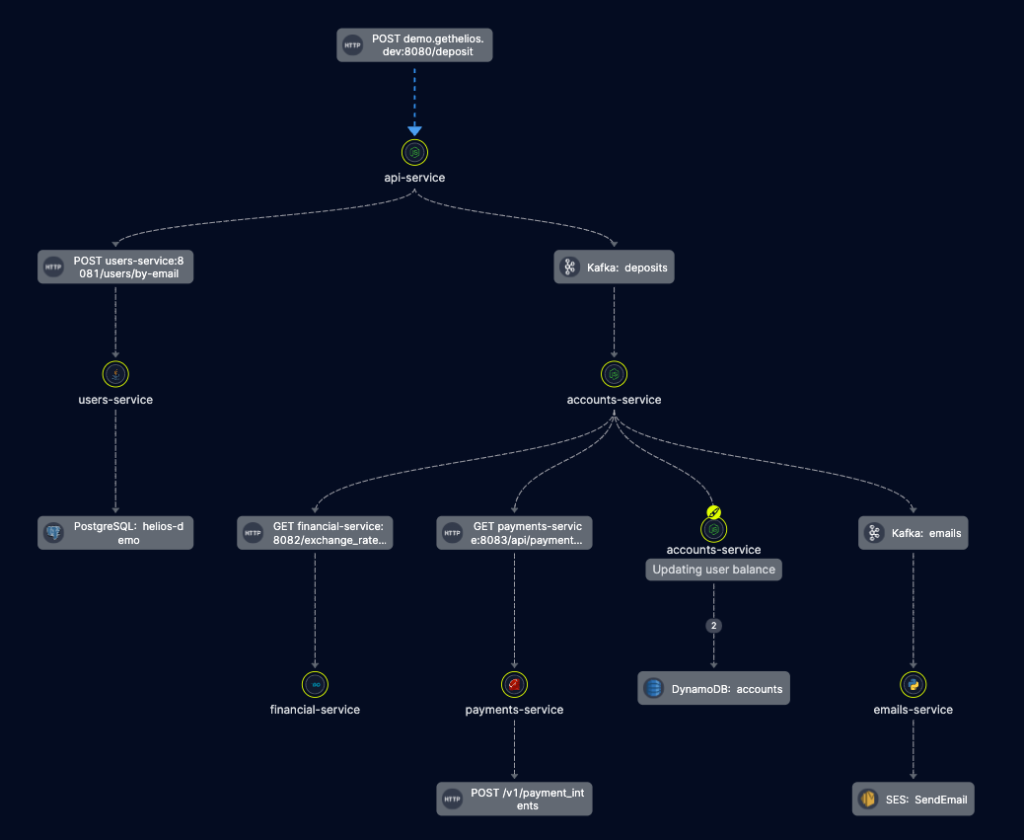
Here’s what it looks like in Helios:
How Distributed Tracing Has Been Used So Far
Despite the growing popularity of tracing (thanks to solutions like OpenTelemetry, OpenTracing, Jaeger, and Zipkin), for most organizations, the first and only time they consume distributed tracing data is when it is processed by their APM vendor. In the past few years, APM vendors like Datadog and New Relic have added distributed tracing into their production monitoring solutions, enhancing the metrics and logs information with this powerful signal.
By adding traces, these vendors were able to provide insights beyond the “classic” errors and metrics. This allowed them to provide more data-driven context for developers who were looking to investigate production issues in distributed environments.
As we’ve claimed before, distributed tracing is a game changer for developers in cloud-native, microservices-based environments, as they provide a wide range of new opportunities. But in many cases today, and especially if they are looking through the lenses of APMs, developers only get access to this data after their code is in production. This does not always answer developer needs for troubleshooting and debugging their code.
Why APM Distributed Tracing is Not Enough
In some cases existing APM solutions are good enough – like when troubleshooting a performance bottleneck or locating a bad API call. But in many cases, the granularity of the collected data, as well as the visualization capabilities, are simply not adequate for the developer’s investigative needs.
As a result, developers are still left in the dark when it comes to developing for microservices. They still have to manually go through logs or keep attempting to recreate issues on their local environments, attempting to find and resolve them.
Why does this happen?
1. Lack of Sufficient Trace Data
First, APM distributed tracing solutions don’t collect the payloads data (HTTP request body, Kafka messages, Lambda events, etc.). Instead, they only collect metadata – due to privacy and cardinality considerations, and also lack focus on the developer persona. But metadata is not always good enough for what developers need and certainly not in pre-production environments.
From the perspective of developers, two HTTP requests sent to the same endpoint triggering entirely different DB queries simply can’t be reduced to their HTTP status code and duration of the DB query. It just isn’t enough information. Or, when one 3rd party API call is successful, and another isn’t – only getting the 500 error code isn’t enough to be able to identify and resolve the issue. A developer would need to see the different payloads that were sent in each case. Manually, this could take hours.
2. Partial Visualization
Visualization is also critical – APM vendors often do little to make the trace visualization usable and friendly. In most cases, it’s often limited to a timeline view, based on (or built very similarly to) Jaeger’s. When your goal is mainly focused on finding performance bottlenecks, this may be good enough. But when a developer investigates an applicative issue, navigating through a timeline is simply non-feasible.
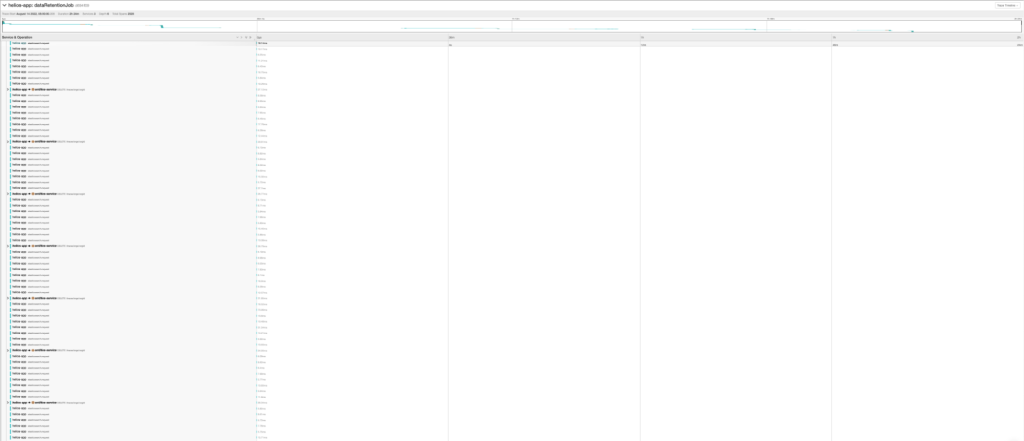
Here’s a timeline view of a specific trace with hundreds of similar operations, with no search/filter, in Jaeger:
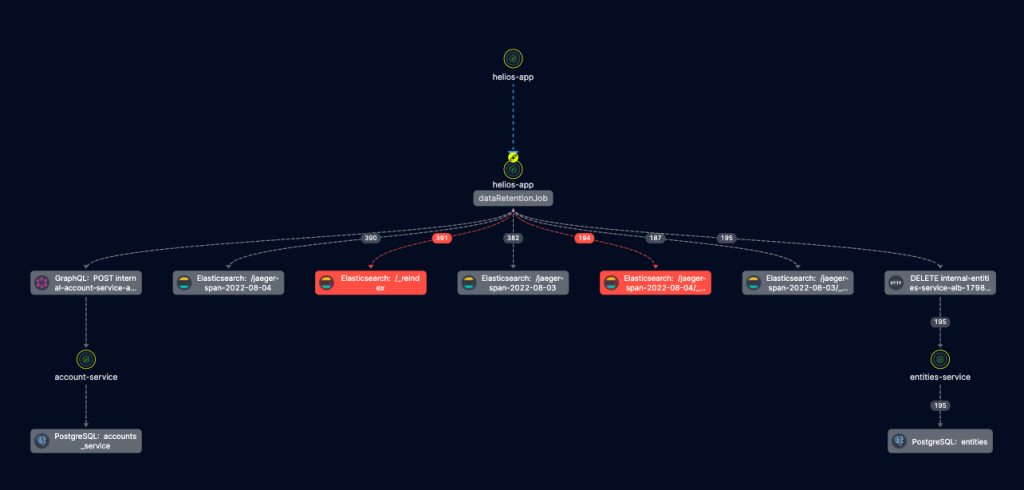
Here’s the same trace in a user-friendly format, while highlighting errors and filter support, in Helios:
Generally speaking, this shouldn’t come as a surprise. The purpose of APM tracing isn’t to support developers in their day-to-day, but rather to help DevOps/SREs when a production issue occurs. Different persona, different use case – and subsequently, different product features.
So What Do Developers Actually Need From Distributed Tracing?
Developers need capabilities for tracking and monitoring activities in the entire development process that occurs before production. The code quality challenges we face in production often appeared much earlier, “to the left”. By importing these data capabilities to the earlier part of the dev cycle — and using the data to fix them — we could’ve saved precious time.
Distributed tracing can become the solution for troubleshooting and debugging, but it has to be consumed differently than the existing solutions today. A distributed tracing solution that is actionable for developers should provide the following capabilities:
- Data availability – Distributed tracing information needs to be available in all environments, from local to staging to testing to production.
- Accessibility – Data needs to be available on-demand; immediately after making an API call, when browsing through logs, when getting a report on an error, etc.
- Context – Developers need to be able to see the information in full context. For example, seeing the payloads (e.g., HTTP request/response body), headers, and essentially all the span attributes are a must.
- Searchable – Developers should be able to filter the data (by errors/components), and search inside it.
- Collaboration – Data needs to be shareable with the team and enable adding annotations.
Distributed tracing has a great potential for debugging and troubleshooting microservices before production. But APM solutions just weren’t designed for that need. Helios leverage distributed tracing to ensure production readiness. How about giving it a spin?


