
Kafka monitoring: Message brokers observability and troubleshooting
Message brokers like Kafka enable microservices scalability. But monitoring them lacks context. Here are 3 solutions: Redpanda, Kafka Owl, and trace-based Helios
Golang Distributed Tracing – OpenTelemetry Based Observability
OpenTelemetry (OTel in short) is an open-source observability framework that provides a standard set of vendor-agonistic SDKs, APIs, and tools to connect with observability backends. It supports all major programming languages, including Java, Python, Node.js, and Go. In short, it lets you collect, export, and analyze telemetry data from your applications and services, including metrics, […]
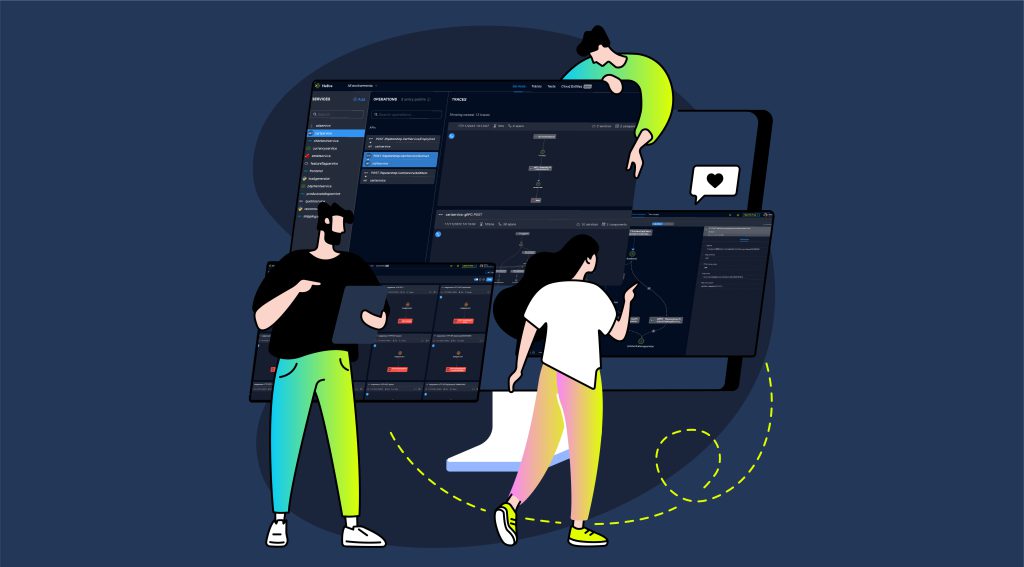
Microservices Monitoring: Cutting Engineering Costs and Saving Time
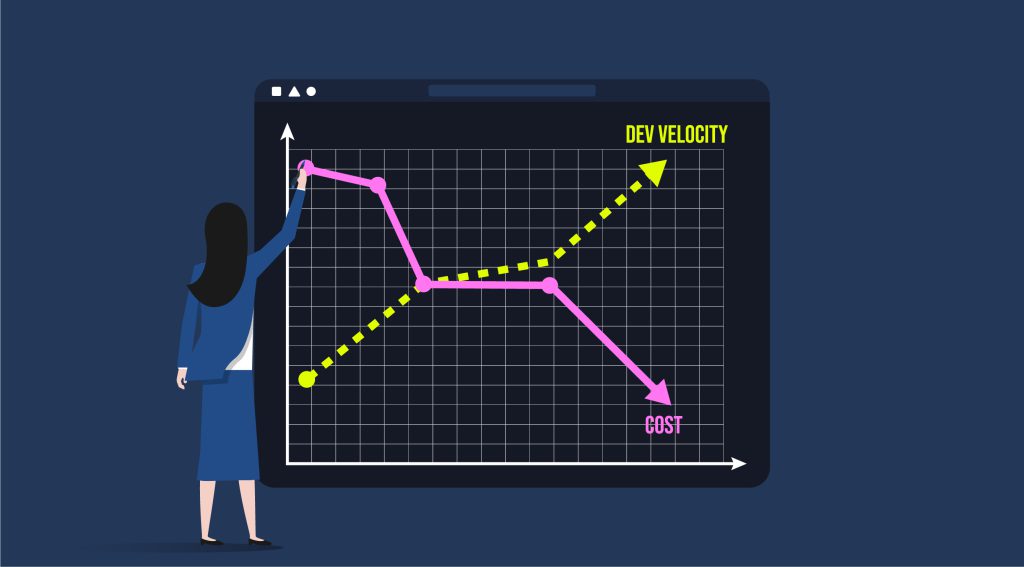
A few ways that leveraging Helios will save your developers time and make your organization more resource-efficient for 2023
Trace-based Testing: Modern Testing for the Modern Infrastructure
Traditional software application infrastructure generally followed a monolithic pattern; one application connected to one database. Understanding what was going on inside the application itself was a simple proposition, with relevant logs and metrics all originating from the same source. When it came time to scale, the answer was to get a bigger server or to […]
A better developer experience: Applying observability to 3rd-party integrations
3rd party integrations can be tedious because of lack of visibility into behind-the-scenes processes. Here’s how to use 3rd-party integrations’ observability to identify errors fast, making development more efficient. 3rd party integrations are inevitable in development. Some functionality is outsourced as there is no need to develop something in-house that’s already working, while some […]
Unlock the power of OpenTelemetry and Helios through the OTel community demo
Developers can now experience hands-on the combined value of OTel and Helios when building distributed applications with this OTel community demo OpenTelemetry (OTel), the emerging industry standard for collecting observability data, recently announced the GA of its demo application – and this is good news for distributed tracing fans. Developers can now get a […]
What Can OpenTelemetry Distributed Tracing Architecture Do for Frontend Developers?
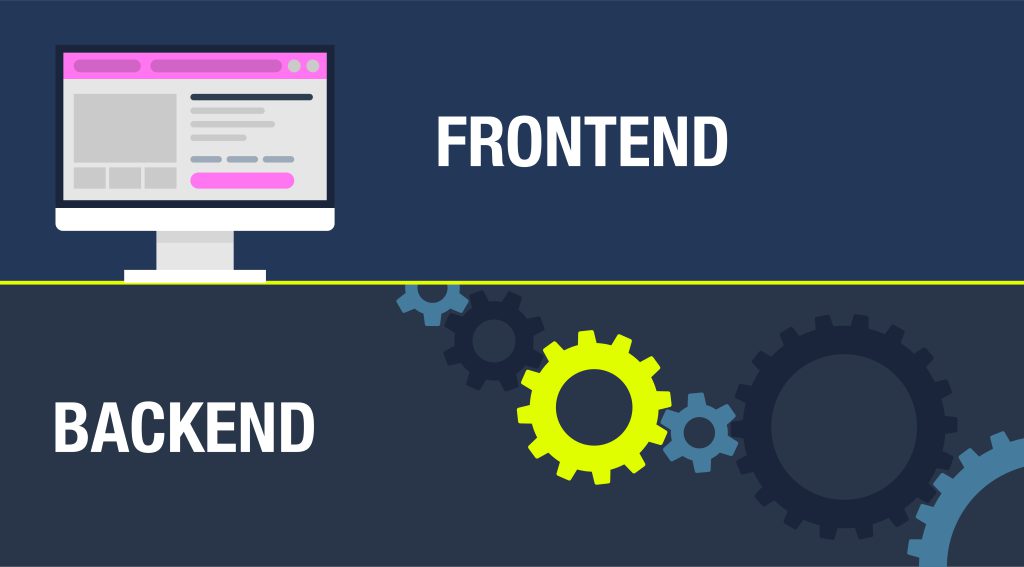
Can OTel help full-stack and front-end developers? Here’s how to use OpenTelemetry for frontend troubleshooting, with examples.
Visualizing GraphQL Traces in Microservices
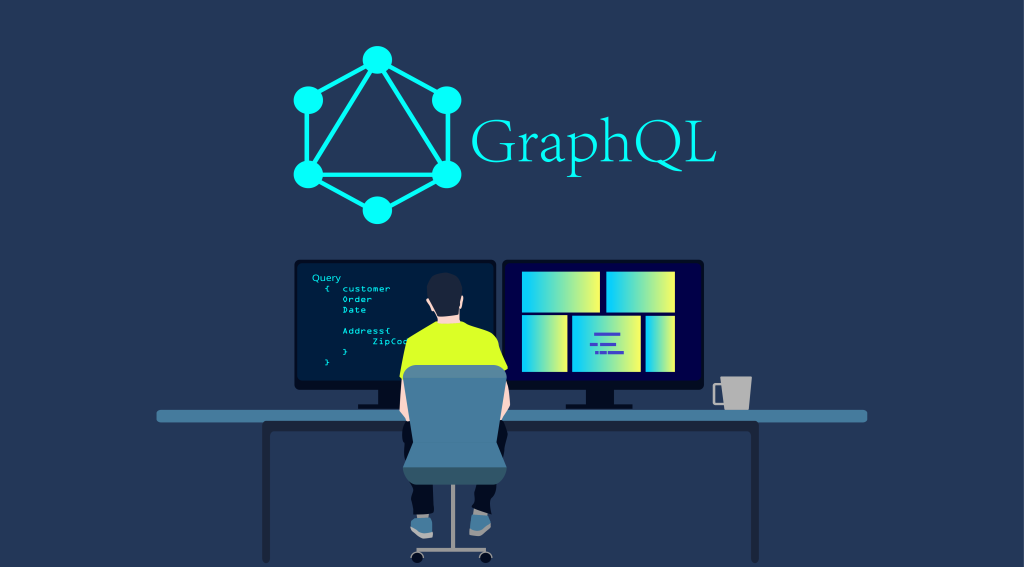
Learn to use GraphQL to visualize your microservices with traces. This guide will show you how to with Helios.
OpenTelemetry Java – Your Guide to Getting Started
Learn to deploy OpenTelemetry with Java to collect services data. Use Jaeger Helios and other tools and troubleshoot with distributed tracing

