


Unlocking the magic of distributed tracing across all kinds of interactions between microservices with context propagation
In our line of work, it’s not uncommon to encounter customers that have custom workflows or architectures that may not always support distributed tracing mechanisms. In development in general, we often have our beliefs on what should happen in theory and we rely on Hello-World examples, only to be surprised by what happens in reality. Our customers too sometimes have to build creative solutions to deal with unique situations – which then motivates us to build creative solutions as well.
We’ve recently come across several interesting use cases across our customers who installed Helios to integrate distributed tracing into their system, and ended up seeing parts of a specific flow broken into several traces instead of a single one.
This meant they were missing the main benefits of distributed tracing, which allows you to track a specific flow, a request, as it moves and progresses through the system, enabling you to connect the dots between the different components to understand a certain flow. When it works, it can save developers a great deal of time in building and operating modern applications.
We realized the issues our customers were facing stemmed from the trace’s context failing to pass between some components in the flow. We solved these issues by exposing an OpenTelemetry method of propagating context and guided our customers on where to apply it in their specific use-cases. We describe how we did this in two examples below; those are just a drop in the ocean of creative solutions we need to come up with as we encounter more use cases in the field.
Some context on context propagation
But first, a few words on context propagation.
As noted above, distributed tracing is a tool used to monitor applications, particularly those using microservices. OpenTelemetry (OTel) enables organizations to use distributed tracing by streamlining end-to-end tracing. Requests are tracked as they propagate through distributed systems. Context propagation is a mechanism by which a context object (request metadata) passes in a transaction between and across components in microservices. Metadata collected from multiple components is reassembled into a coherent trace capturing what happened in that specific flow.
Propagation is often performed by utilizing HTTP headers. There are currently several protocols for context propagation that OTel recognizes which are implicit (performed automatically) and free the programmer from having to explicitly pass the context.
For those cases where context needs to be passed manually – though it may sound simple – it can be challenging to identify which mechanism (“carrier”) can be used to propagate the context (similar to using the request’s headers in HTTP communication) and how and where to implement it.
What happens if the context is not passed?
When the context fails to pass between two components in a specific flow, a new context will be initialized mid-flow, and it’ll be complex, time-consuming, and manual to connect between the parts.
To connect the disjointed parts of the flow into a single trace, we needed to first help our customers think about how and what could be the “carrier” for the context in non-HTTP communications. We then helped them inject the context onto that “carrier” and then extract it at the other side of the transaction.
Here are some of the examples we encountered and how we solved them.
Use case #1: Propagating context in a MongoDB-based async flow
Our customer used MongoDB as a pub-sub platform, where one microservice (A) wrote a document with some information to MongoDB and another microservice (B) was periodically reading from the same collection, fetching the written documents and performing some logic. Of course, MongoDB isn’t a standard way of implementing a pub-sub mechanism, but this happens all the time in the day-to-day of developers – we repurpose existing tools for different purposes. However, using a non-standard way doesn’t mean we shouldn’t be able to propagate the context.
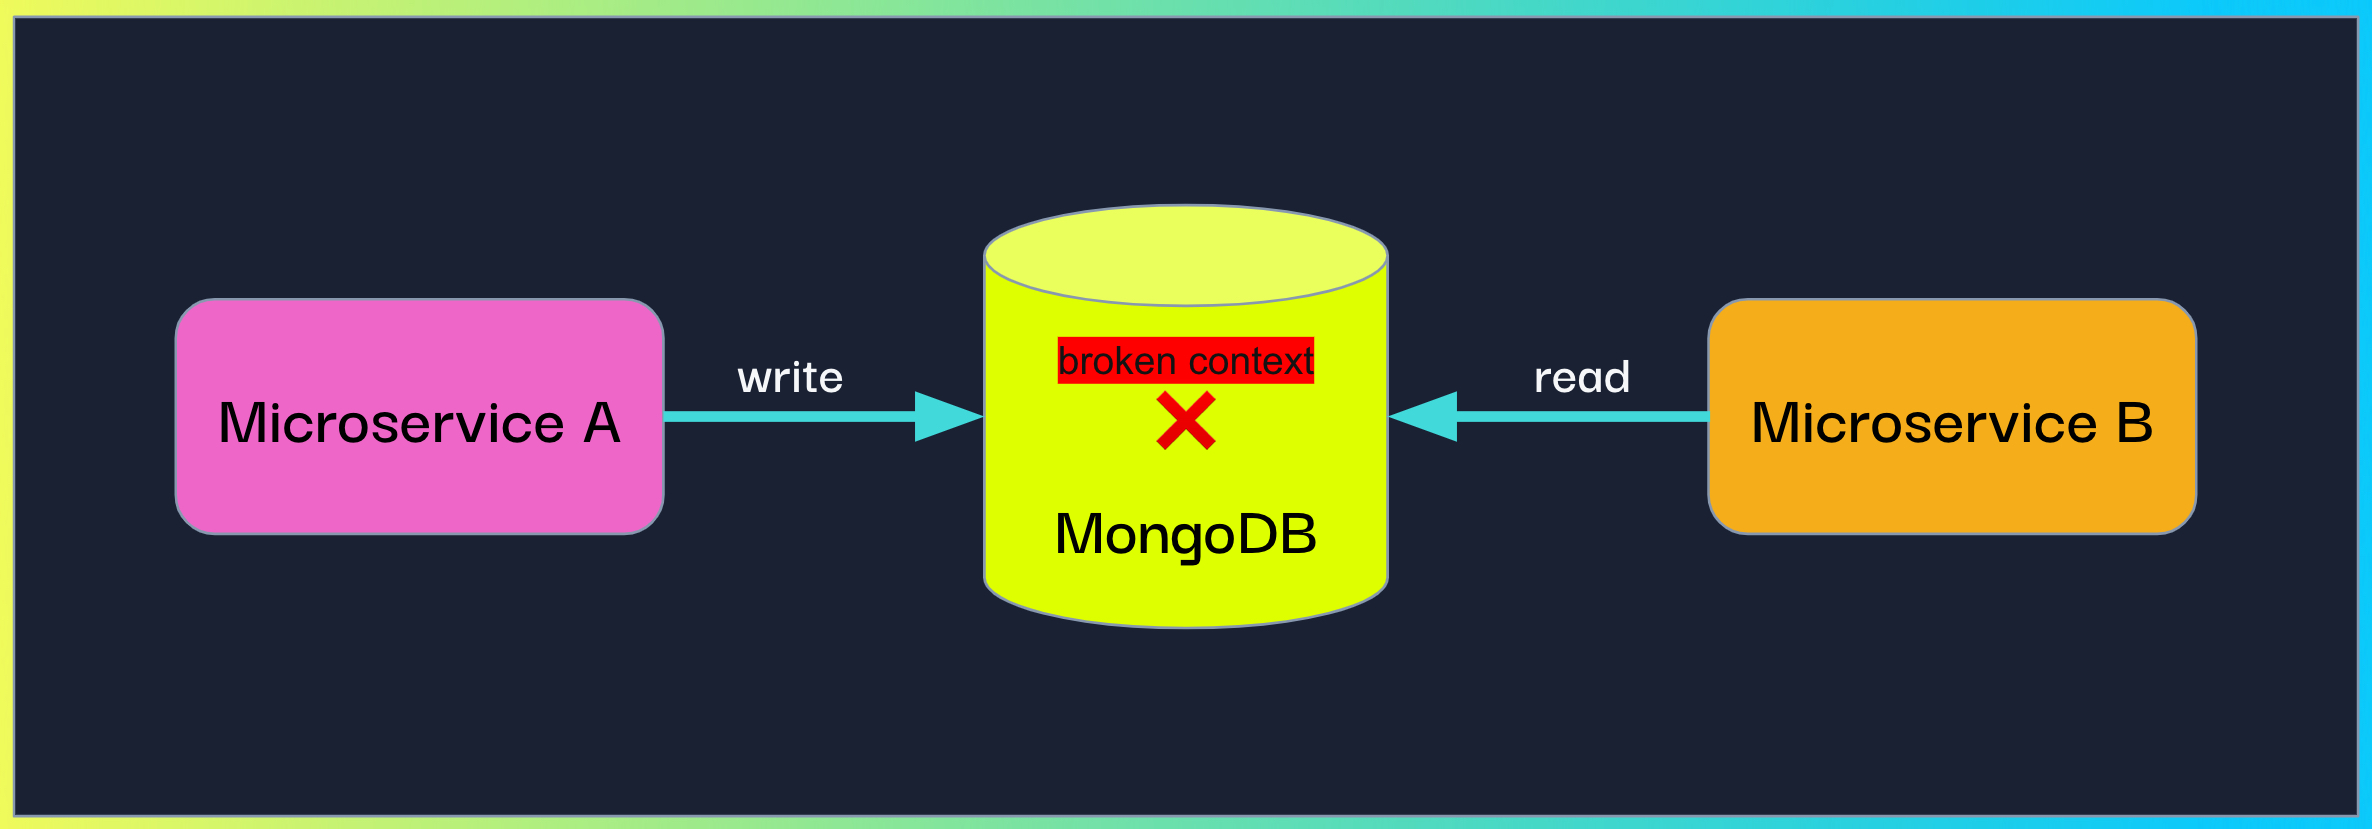
The most straightforward way to propagate the context was to have microservice A inject it into the document and have microservice B extract it.
We exposed OpenTelemetry’s inject method which accepts a “carrier” object (a dictionary by default) and injects the current active context into it. The customer could then write the injected carrier as part of the MongoDB document.
In addition, we exposed the complimentary extract method which accepts a “carrier” and returns the extracted context. The customer had to call both these methods, in microservice A and microservice B respectively, and then attach the context to the current run.
Microservice A code:
from helios import inject_current_context
document = ...
document['context'] = inject_current_context(dict())
mongo_client.db.collection.insert_one(document)
Microservice B code:
from helios import extract_context
from opentelemetry.context import attach

doc = mongo_client.db.collection.find_one({"_id": id})
extracted_ctx = extract_context(doc.get('context'))
attach(extracted_ctx)
Use case #2: Propagating context to a programmatically-created Kubernetes job
In this more complex use case, another customer of ours was creating and running K8s jobs programmatically and wanted to trace this flow up to the actual logic the K8s job was running.
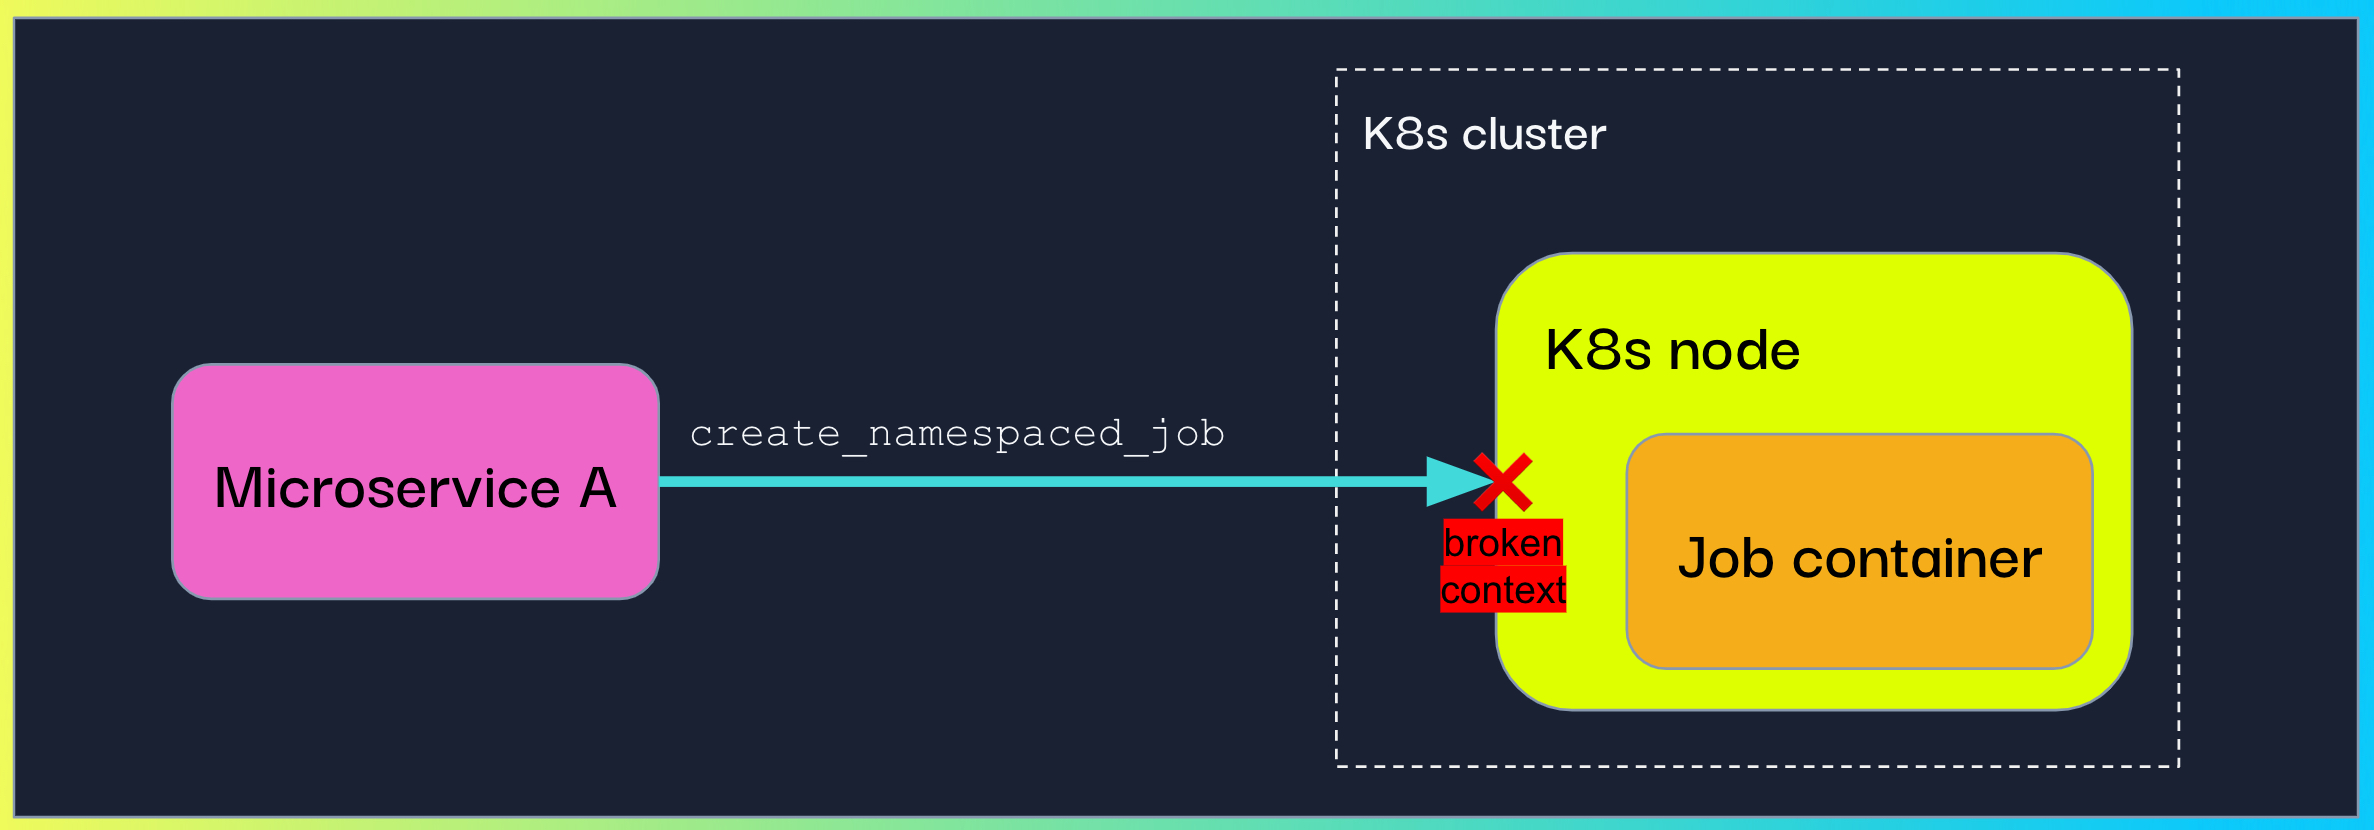
Here it was a bit trickier to understand what could carry the context. We explored the K8s API, and decided to harness the environment variables. For that we needed to call the inject method with the K8s API custom object for environment variables (V1EnvVar). Luckily, a custom Setter is an additional parameter the OpenTelemetry inject method accepts and so we instructed our customer to use it in order to inject the context.
Microservice A code:
from helios import inject_current_context

class K8sEnvSetter:
    def set(self, carrier, key: str, value: str) -> None:
        carrier.append(client.V1EnvVar(name=key, value=value))

env = [ client.V1EnvVar(...), client.V1EnvVar(...), ... ]

inject_current_context(env, K8sEnvSetter())

# Create the container section that will go into the spec section
container = client.V1Container(..., env=env)

# Create and configurate a spec section
template = client.V1PodTemplateSpec(..., spec=client.V1PodSpec(...,containers=[container]))

# Create the specification of deployment
spec = client.V1JobSpec(template=template, ...)

# Instantiate the job object
job = client.V1Job(..., spec=spec)

api_instance.create_namespaced_job(body=job, ...)
As before, the context also needed to be extracted and attached in the job’s logic. This could be done in a similar way by writing a custom Getter. We decided to make this step implicit for our customers and implemented an automatic extraction when identifying that the code is running in a K8s job.
Summary
The couple of examples above are just a drop in the bucket of architecture patterns developed by different engineering teams who want to leverage distributed tracing. Some teams face challenges in understanding how to propagate context so that their flows are coherent and complete and Helios can help.
Today, distributed tracing is the best way to turn on a light in what can often be a murky environment across microservices. Distributed tracing is the only way to troubleshoot effectively and see what’s happening in your system end-to-end. The examples we shared above are from our experience working with real-world architectures where sometimes flows may not lend themselves perfectly to distributed tracing. But with some creativity, we can find ways to help customers propagate context so they can get a full and clear picture of what’s happening in their system. These are our stepping stones to helping the dev community and I hope you find it useful in your own distributed tracing experiences. You are invited to learn more on context propagation here.


