


Today, many businesses are adopting a more conservative mindset when it comes to their resources. Cloud-native and modern dev organizations are looking for ways to cut costs and increase efficiency. But, of course, without slowing down development velocity. Let’s discuss a few ways that leveraging advanced methods for microservices monitoring can reduce engineering costs, and dev time, and lower to make organizationS much more resource-efficient while still increasing the speed and quality of the development.
1. With Proper Microservices Monitoring Capabilities, Developers Will Spend Less Time Writing Logs
Engineers developing software in modern cloud environments are working across more than one service. They can deliver at higher velocity, but when things break down they find themselves plumbing logs looking for problems. Issues and bugs are unavoidable, the problem is that logs lack sufficient granularity and they can only be investigated if they were inserted by developers before pushing code to production.
This is where distributed tracing comes in. Tracing provides an understanding of application behavior in a distributed infrastructure. By following user requests throughout microservices, tracing provides visibility into how services interact with each other, which can be leveraged into insights that can help with monitoring and troubleshooting microservices. That’s where OpenTelemetry comes in.
OpenTelemetry is an efficient and powerful solution for setting up tracing. But just setting up tracing with OpenTelemetry isn’t enough if you don’t have good tooling to help you make sense out of the data that is being collected. Helios is a solution for dev-first distributed tracing, powered by OTel, for observability, troubleshooting, and testing microservices. It collects payloads and makes sense out of your tracing data, bubbling up errors and showing you where in your environment the problems are arising.
This is what microservices monitoring and observability with Helios look like. As you can see, DB queries are collected automatically.
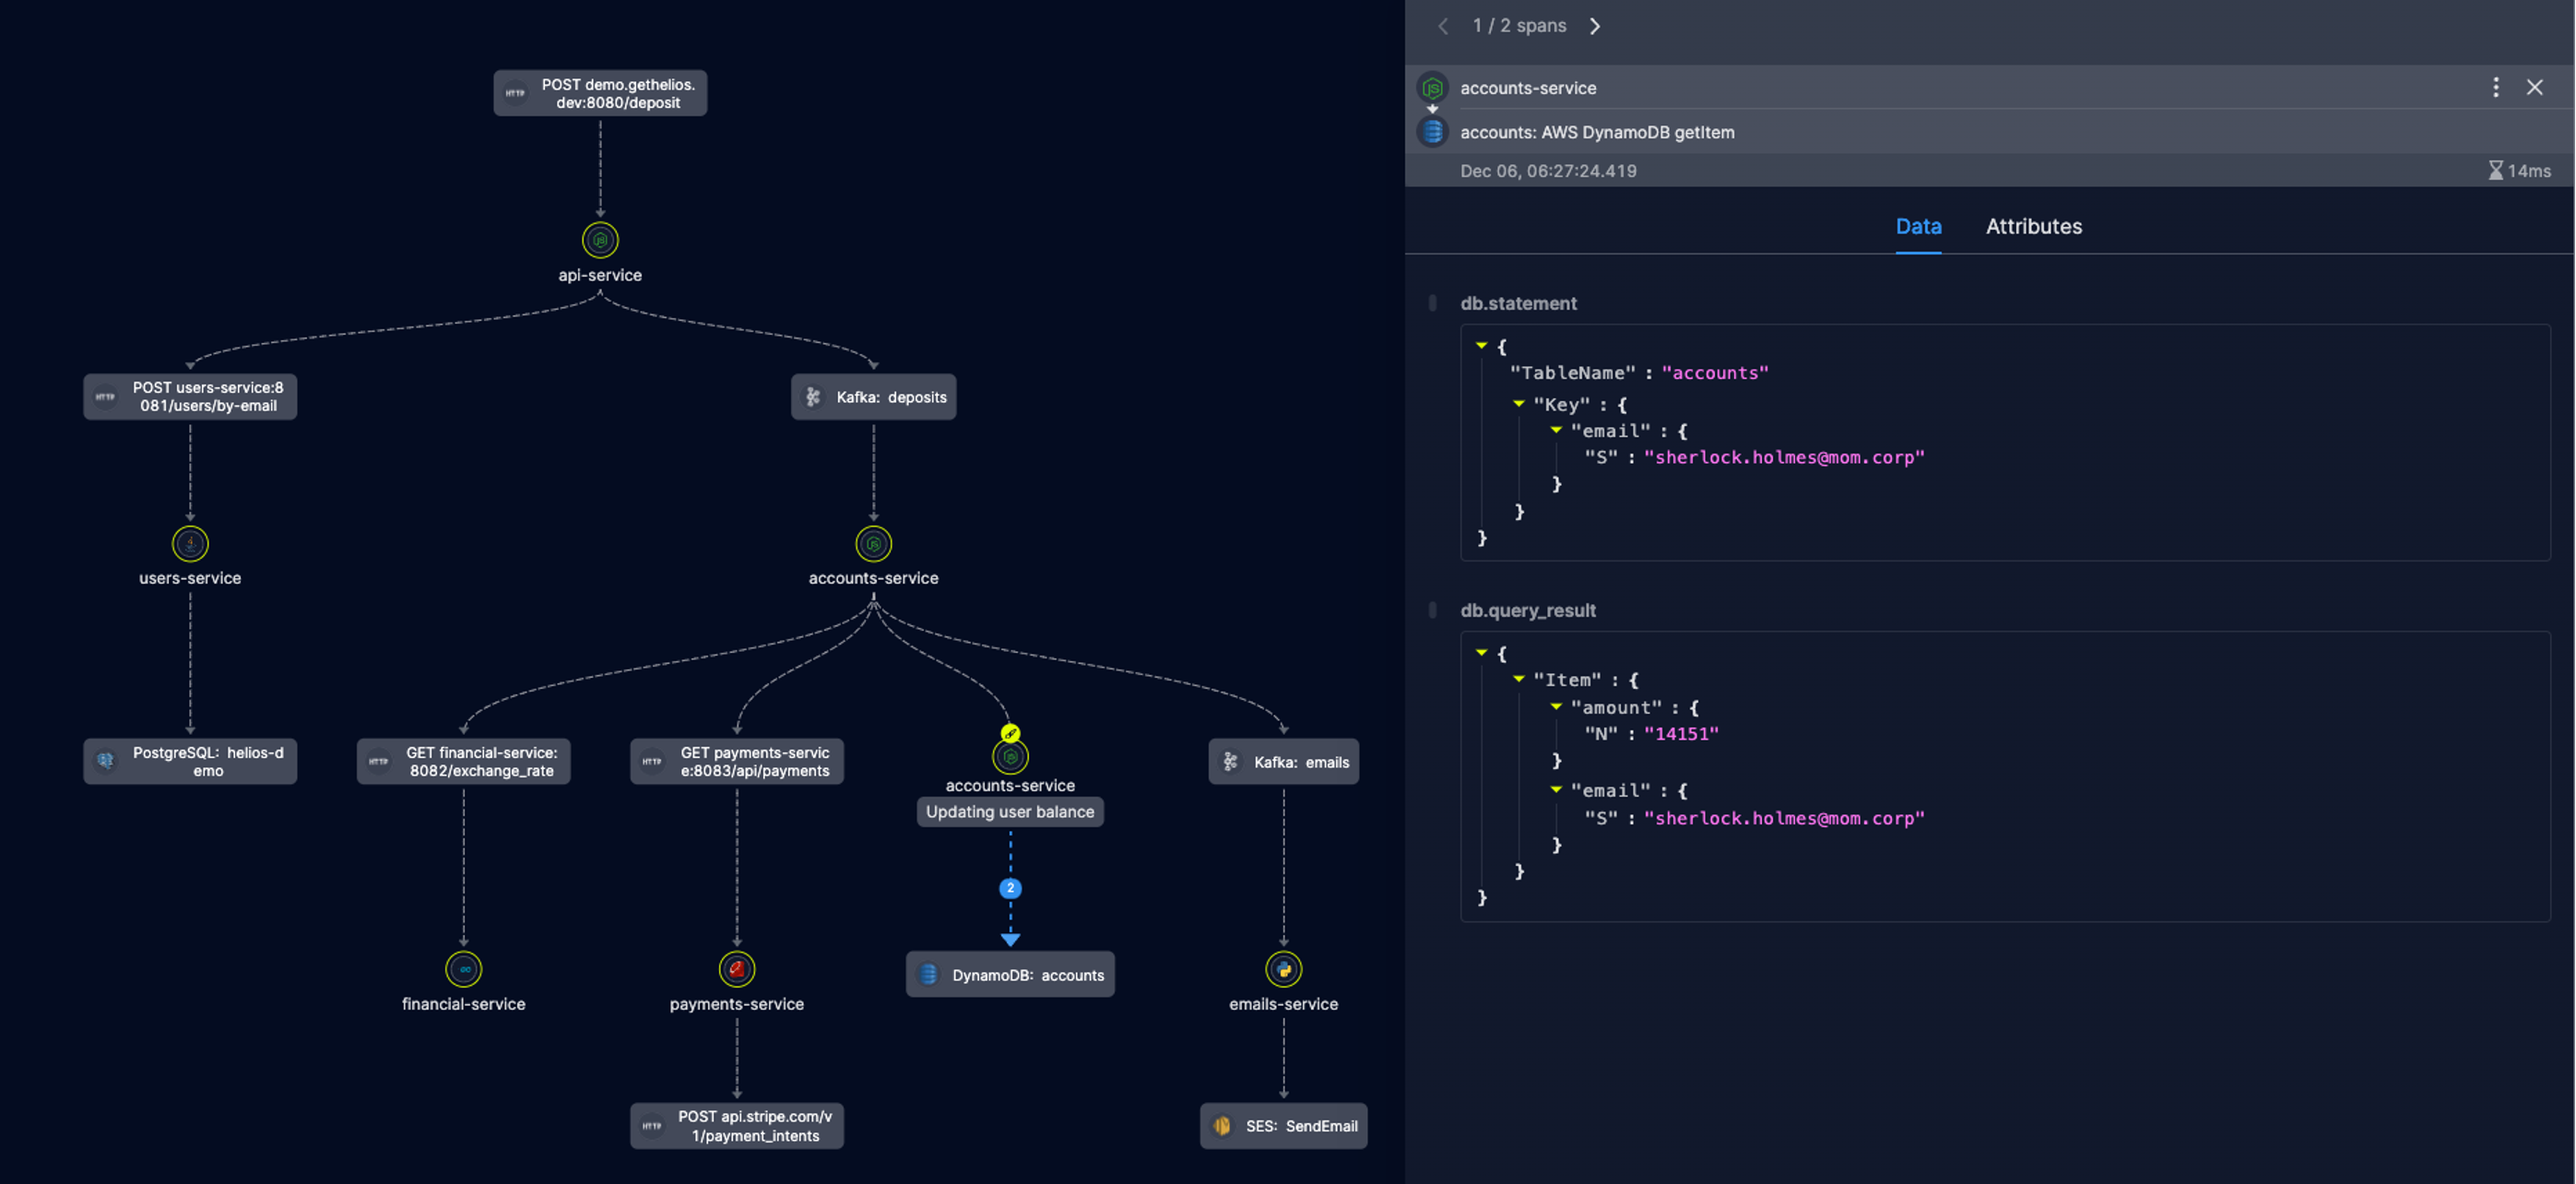
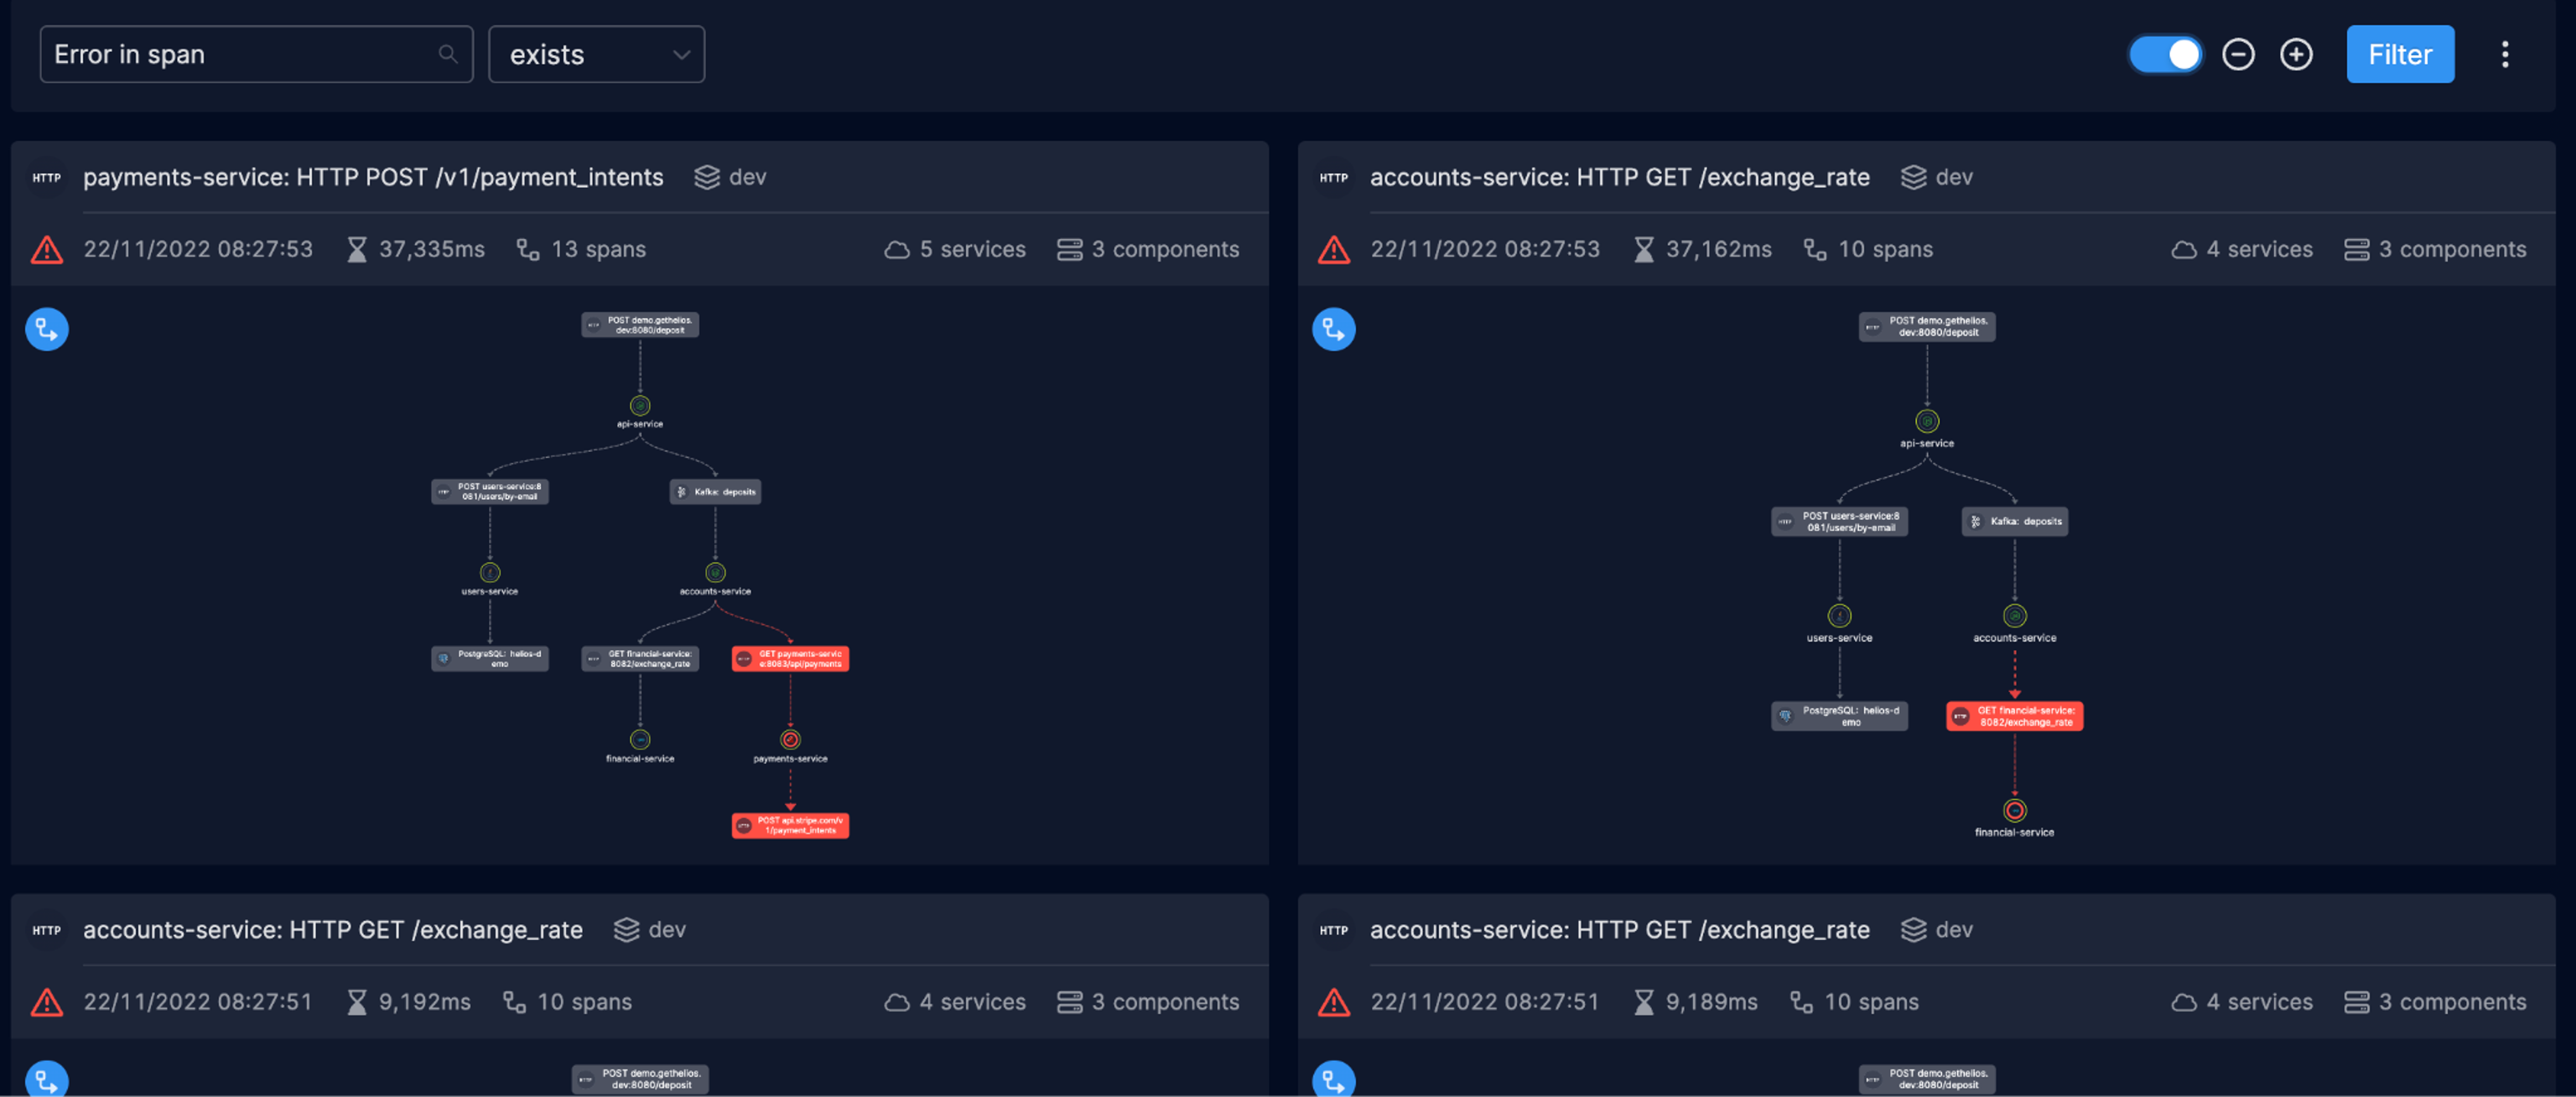
An overview of traces in the environment sorted by those where an error exists.
2. Microservices Observability Lets Developers View an Auto-generated Service Map
When new developers join the team it can be difficult for them to grasp all the services running in an environment and how they communicate with one another. A service map helps draw this out in a way that is easy to grasp. Helios will draw a service map for you. One that is easy to understand and has incredible depth. This saves time otherwise spent pouring over outdated documentation, asking senior developers for assistance or going through trial and error in an attempt to understand how services connect.
But a service map is not just for onboarding purposes. New and old developers will all struggle to understand where problems are happening in a complex environment. Helios’s service map will help your teams understand what is happening, where it’s happening, and what needs to be fixed.
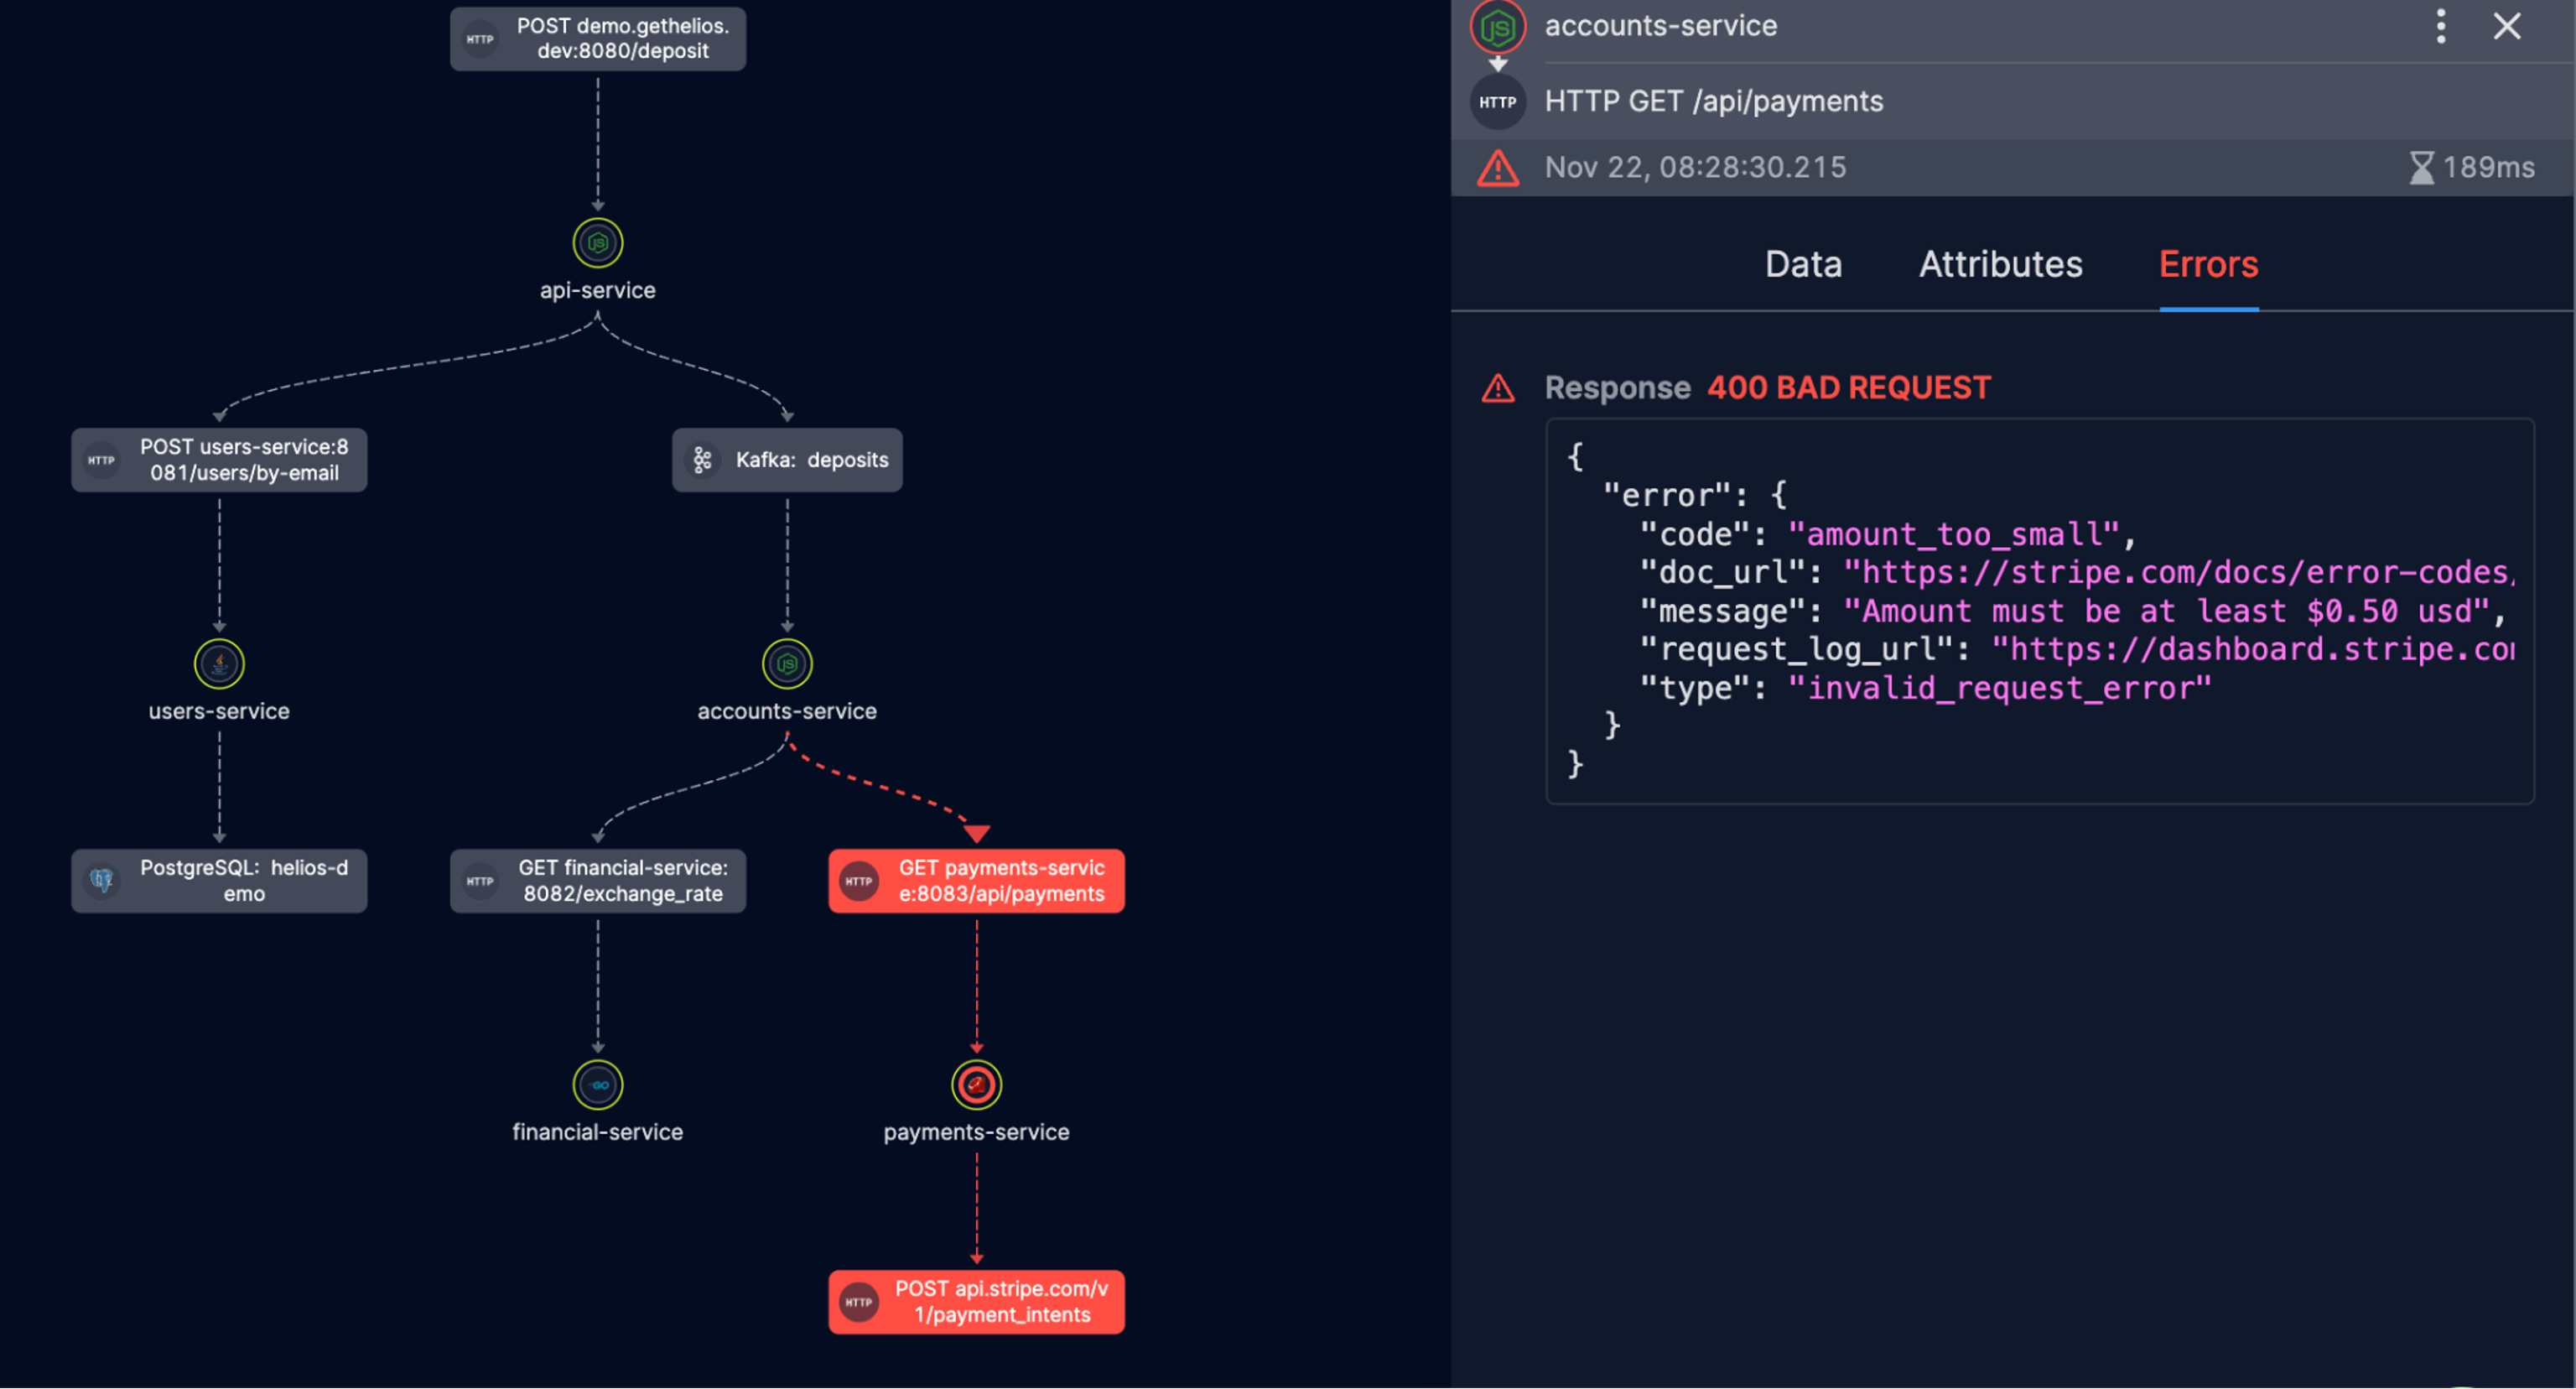
A generated service map with the error found listed on the right.
3. Troubleshooting Microservices Problems Will Happen Faster and More Efficiently
Once a developer finds a problem in a service, the first thing they’ll want to do is re-run the same flow and test if they’re understanding of the problem truly is the problem. This is the workflow where someone is saying, “Ah, THAT was the problem… well if that’s the case then doing THIS should solve the problem… let’s find out.”
Rather than re-compiling or re-building, and then shipping things through to a new environment before running the flow again, Helios allows you to do it right from within Helios.:
- Choose the entry point you’re investigating
- Expand the trace to get more details, like errors, attributes, payloads, data flows, etc.
- Drill down into error logs as needed.
- Go back to your code and fix the issue – hassle free!
- You can visualize the trace again, to see the issue is indeed resolved.
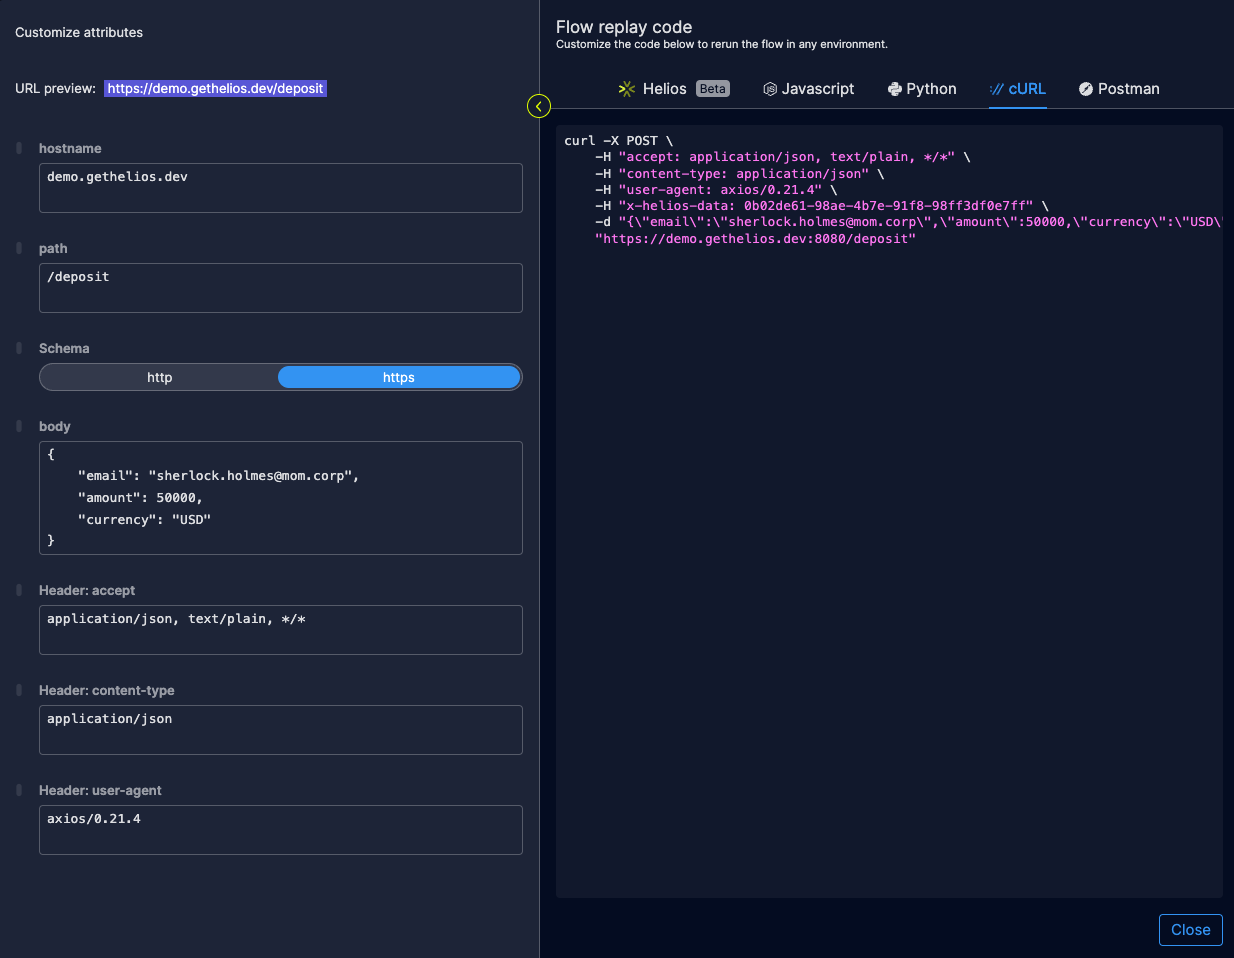
Replay a flow from right inside of Helios with ease. Or generate code to cURL from the terminal et al…
Once the issue is found you’ll be typing:
git commit -m “found the problem, fixed it”
rather than
git commit -m “trying this 14th thing that might be the problem, probably not my last change, dear God save us all”
4. The Time it Takes to Write Tests Will Be Reduced to Minutes (Not Days)
Once you found the issue and ran it through the ringer of your troubleshooting process, you’ll want to write tests to keep it from recurring. But testing is a time-consuming and complex process.
Guess what? Helios can do this for you, speeding up the time it takes to write tests to mere minutes instead of hours or days. Click a button, select a few key spans and hit “generate test code” and you’re off to the races. Tests are generated based on payloads of every communication between components in the system. Tests are built automatically without changing a single code line.
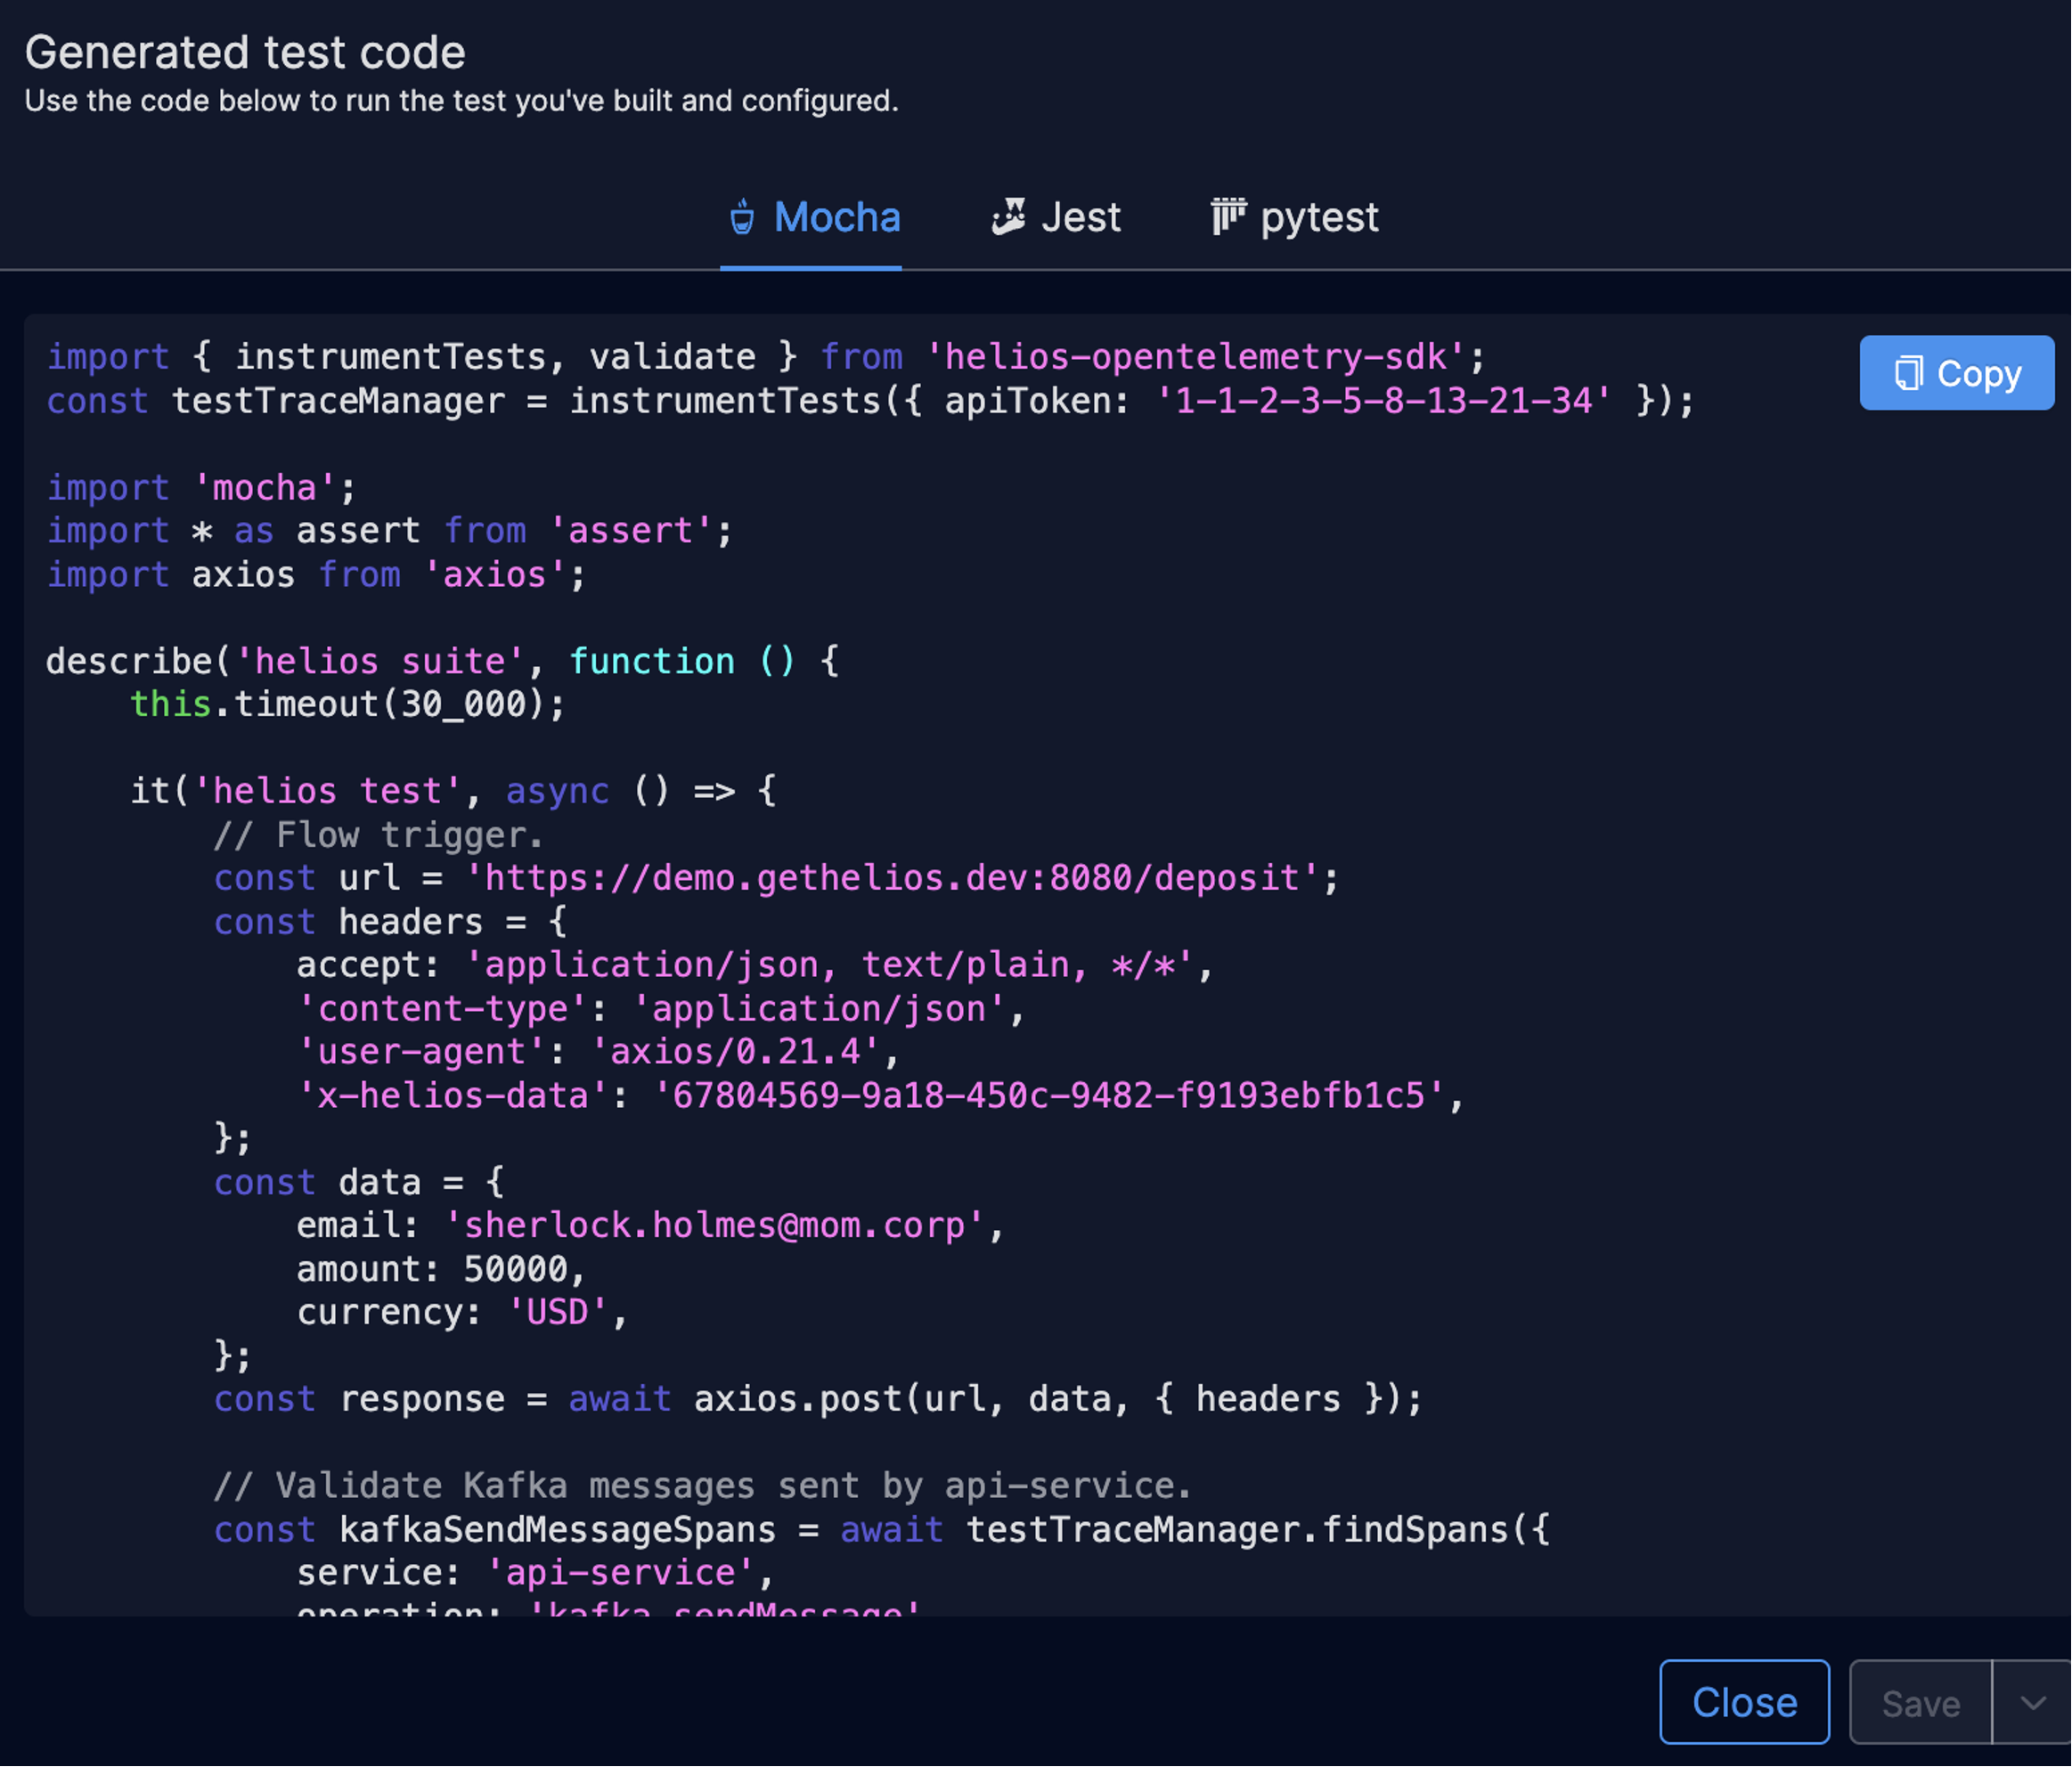
Auto-generated test code.
While there are many ways to decrease spending in a struggling global economy, making your existing staff move faster is one of the lowest hanging fruits. And once Helios is embedded in your workflow, it will have lasting effects on your ability to save resources in development and ship software faster. In the spirit of cutting costs, Helios also has a free tier. Try here.


