

When I first met Uria Franko, the CTO of Novacy, I immediately knew we’d hit it off. He was looking for an observability solution for his team with a specific need around Celery, after they had been using logs but found they lacked the depth and granularity they needed. Luckily, our mission at Helios is to help organizations gain visibility and drill down into services through traces. So this was a perfect match.
Novacy is a behavioral intelligence platform that helps organizations improve their sales activities. Their microservices architecture is made up of their services, Lambdas, and open-source Celery as a task and job queue management solution for background tasks, among other components. The team uses Python as its development language.
The Pain: Observability into Open Source Celery
Their biggest pain point was Celery. “Celery is a black box when it comes to performance and flows,” Uria said. “I need visibility. I can’t see whether requests passed, how long they took and what is going on inside.”
Why Logs Won’t Do
Uria approached us because he’d read that Helios visualizes distributed tracing for fast troubleshooting and debugging. Until then, the team at Novacy had been using Amazon CloudWatch and Grafana for monitoring their services. But the logs provided by CloudWatch were too high level and they didn’t provide the team with granular visibility into their services and into Celery. The team couldn’t dig into their services to find the root cause of issues, which slowed down their troubleshooting and left them hanging with performance issues.
Since Celery and many of the services in Novacy’s architecture are mission-critical, Uria needed a tool that was cost-effective and quick to deploy. They also wanted to start off with a free tier. So we started them off on Helios’s free tier. Helios was implemented in just a few hours.
10 Million Monthly Spans with Helios
Now, the team generates a whopping 10 million spans a month through the Helios SDK. All traces are collected for troubleshooting and debugging.
Helios: Part of the Developers’ Day-to-Day
Novacy uses Helios every day. The team at Novacy uses Helios for:
- Debugging eros
- Finding the root cause of user complaints
- Monitoring performance
- Finding leaks and ways to improve them
I asked Uria to recall an example of when Helios was a game changer for their troubleshooting processes. He quickly came up with a few.
Helios Solves Performance Issues
The first was when the team encountered a performance issue, which they weren’t sure why was happening. With Helios, they found out there was a process that Celery was running that caused the same call to recur hundreds of times. This resulted in a performance issue, since each process was taking five seconds. Once they found the issue, they were able to reduce the process length to one second and optimize performance.
On another occasion, Helios was used to help solve an issue for a customer. Uria used Helios to look for their span and saw the issue immediately and could fix it.
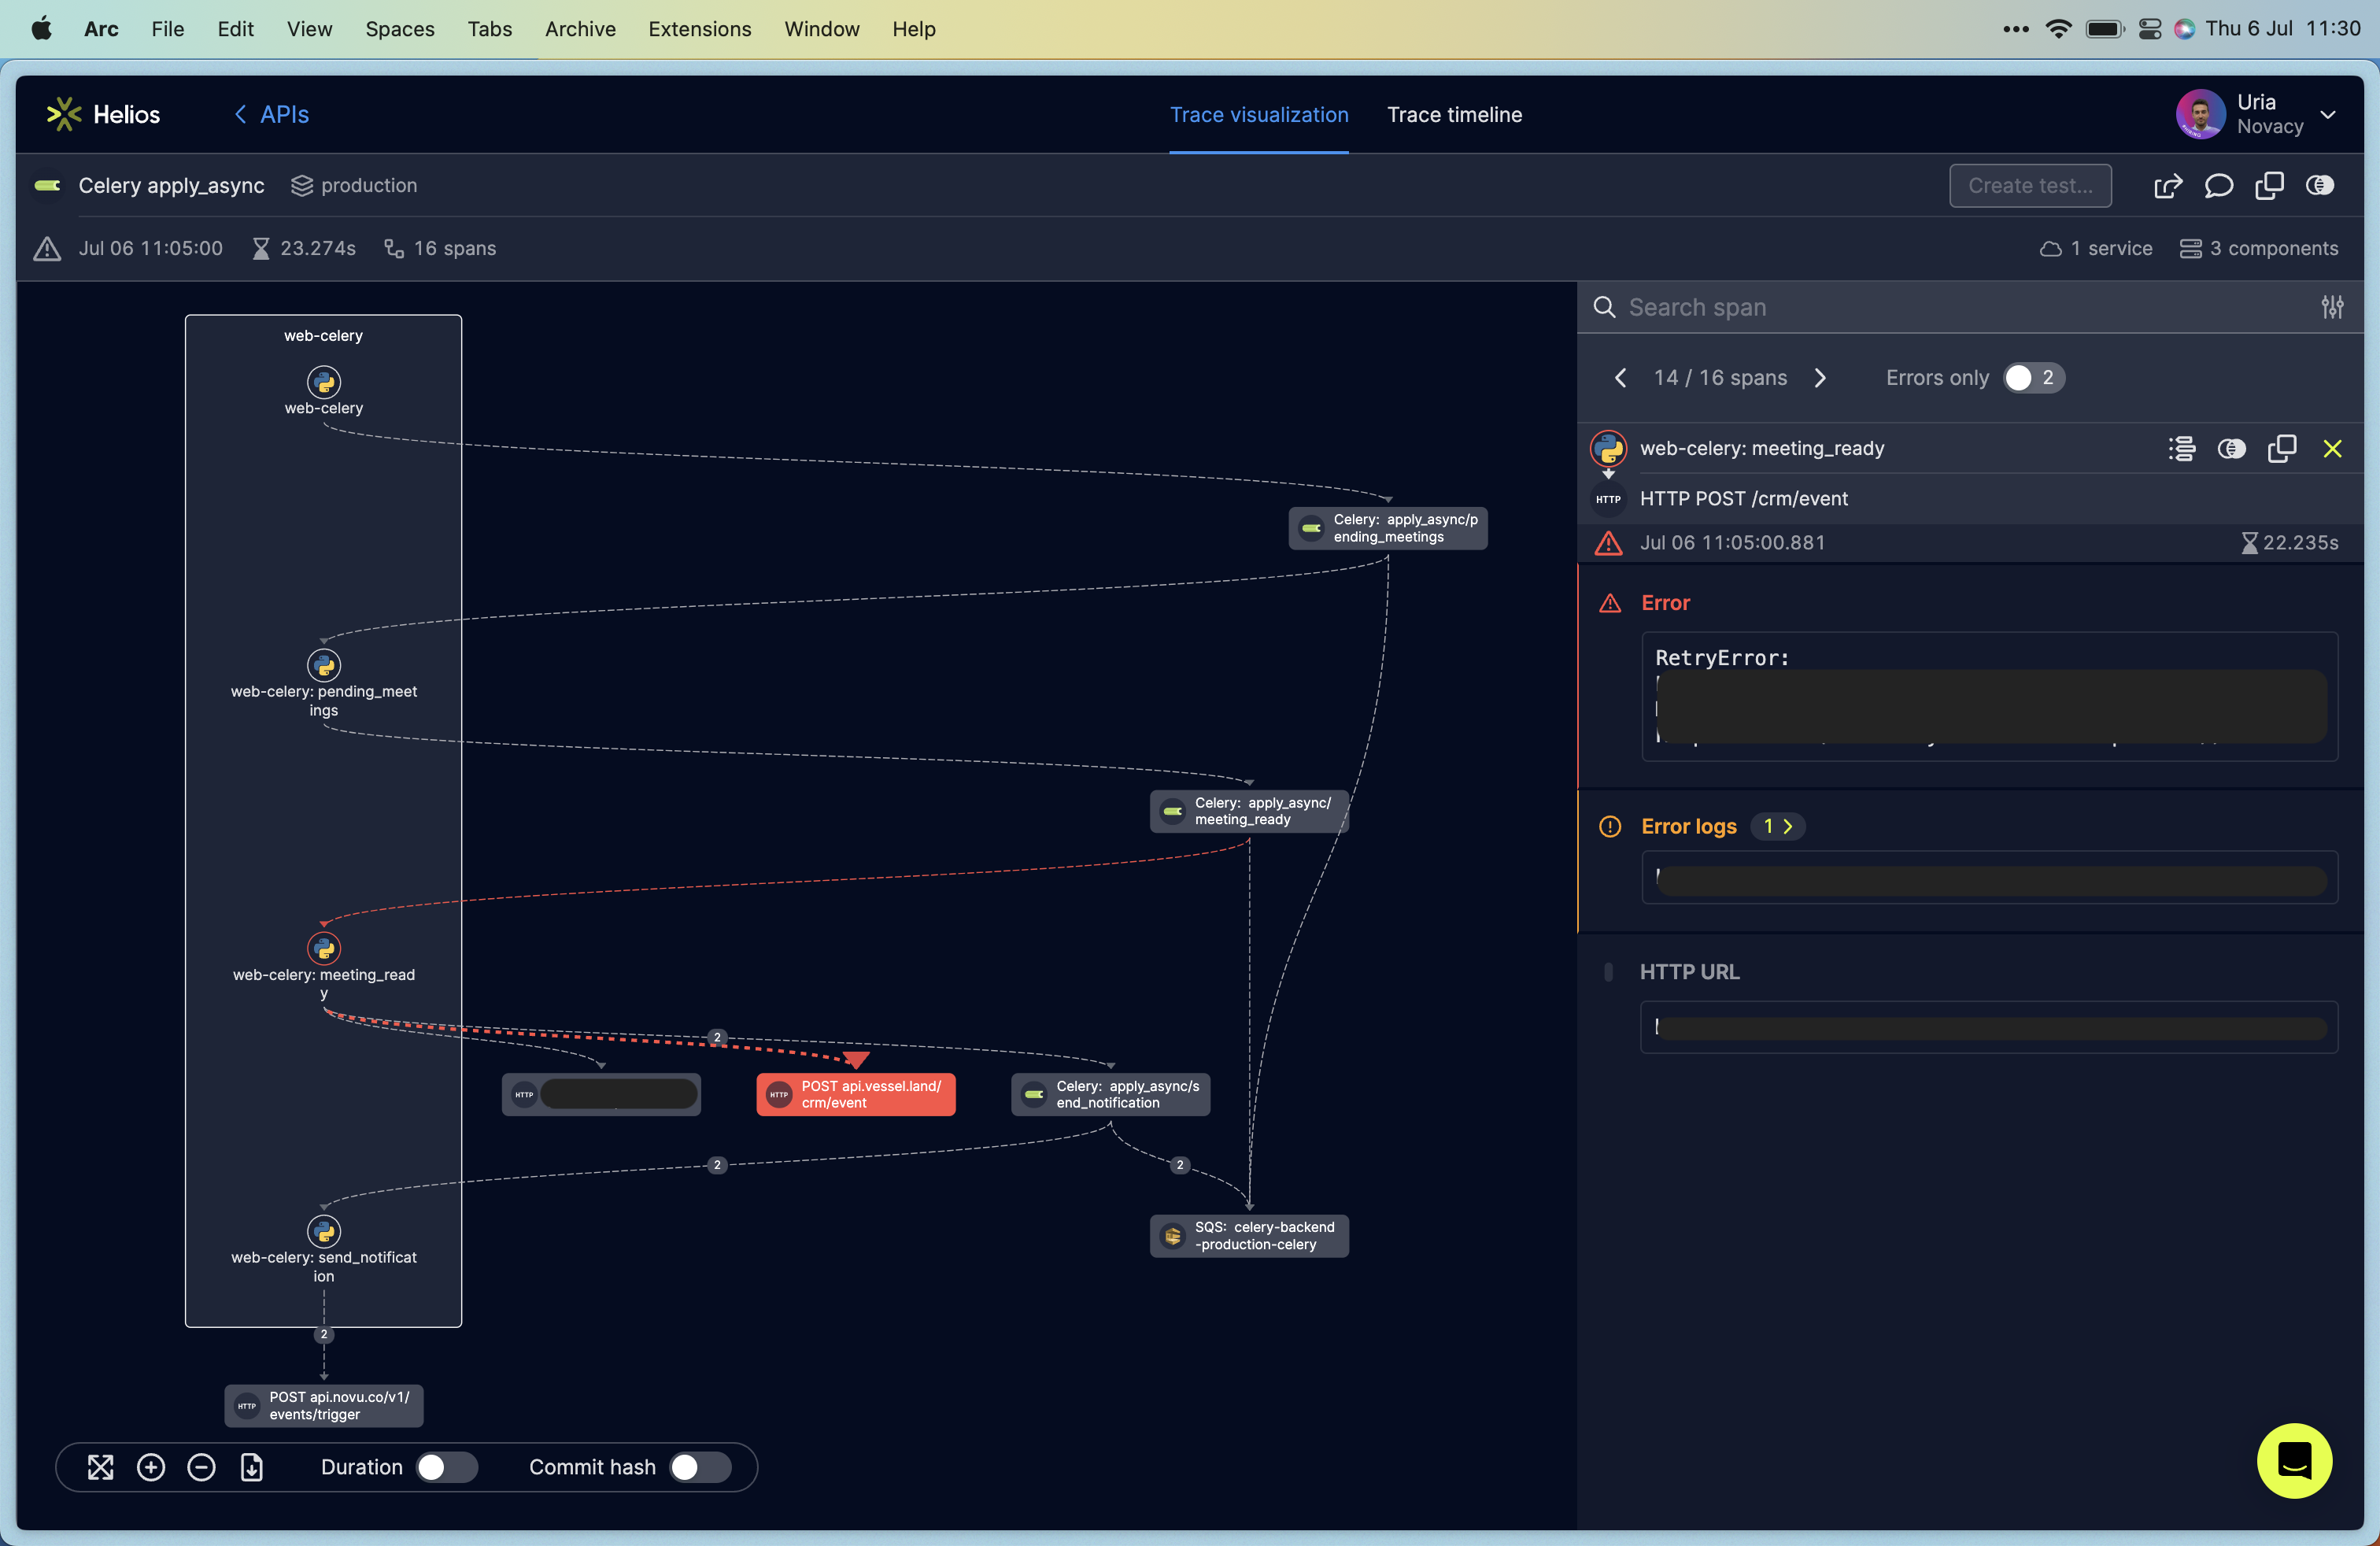
Here’s what their observability into Celery looks like –
Helios shows them their Celery flow with a few tasks inside and the broker’s flow. Thanks to Helios, they can easily see that one of the API requests in one task has failed.
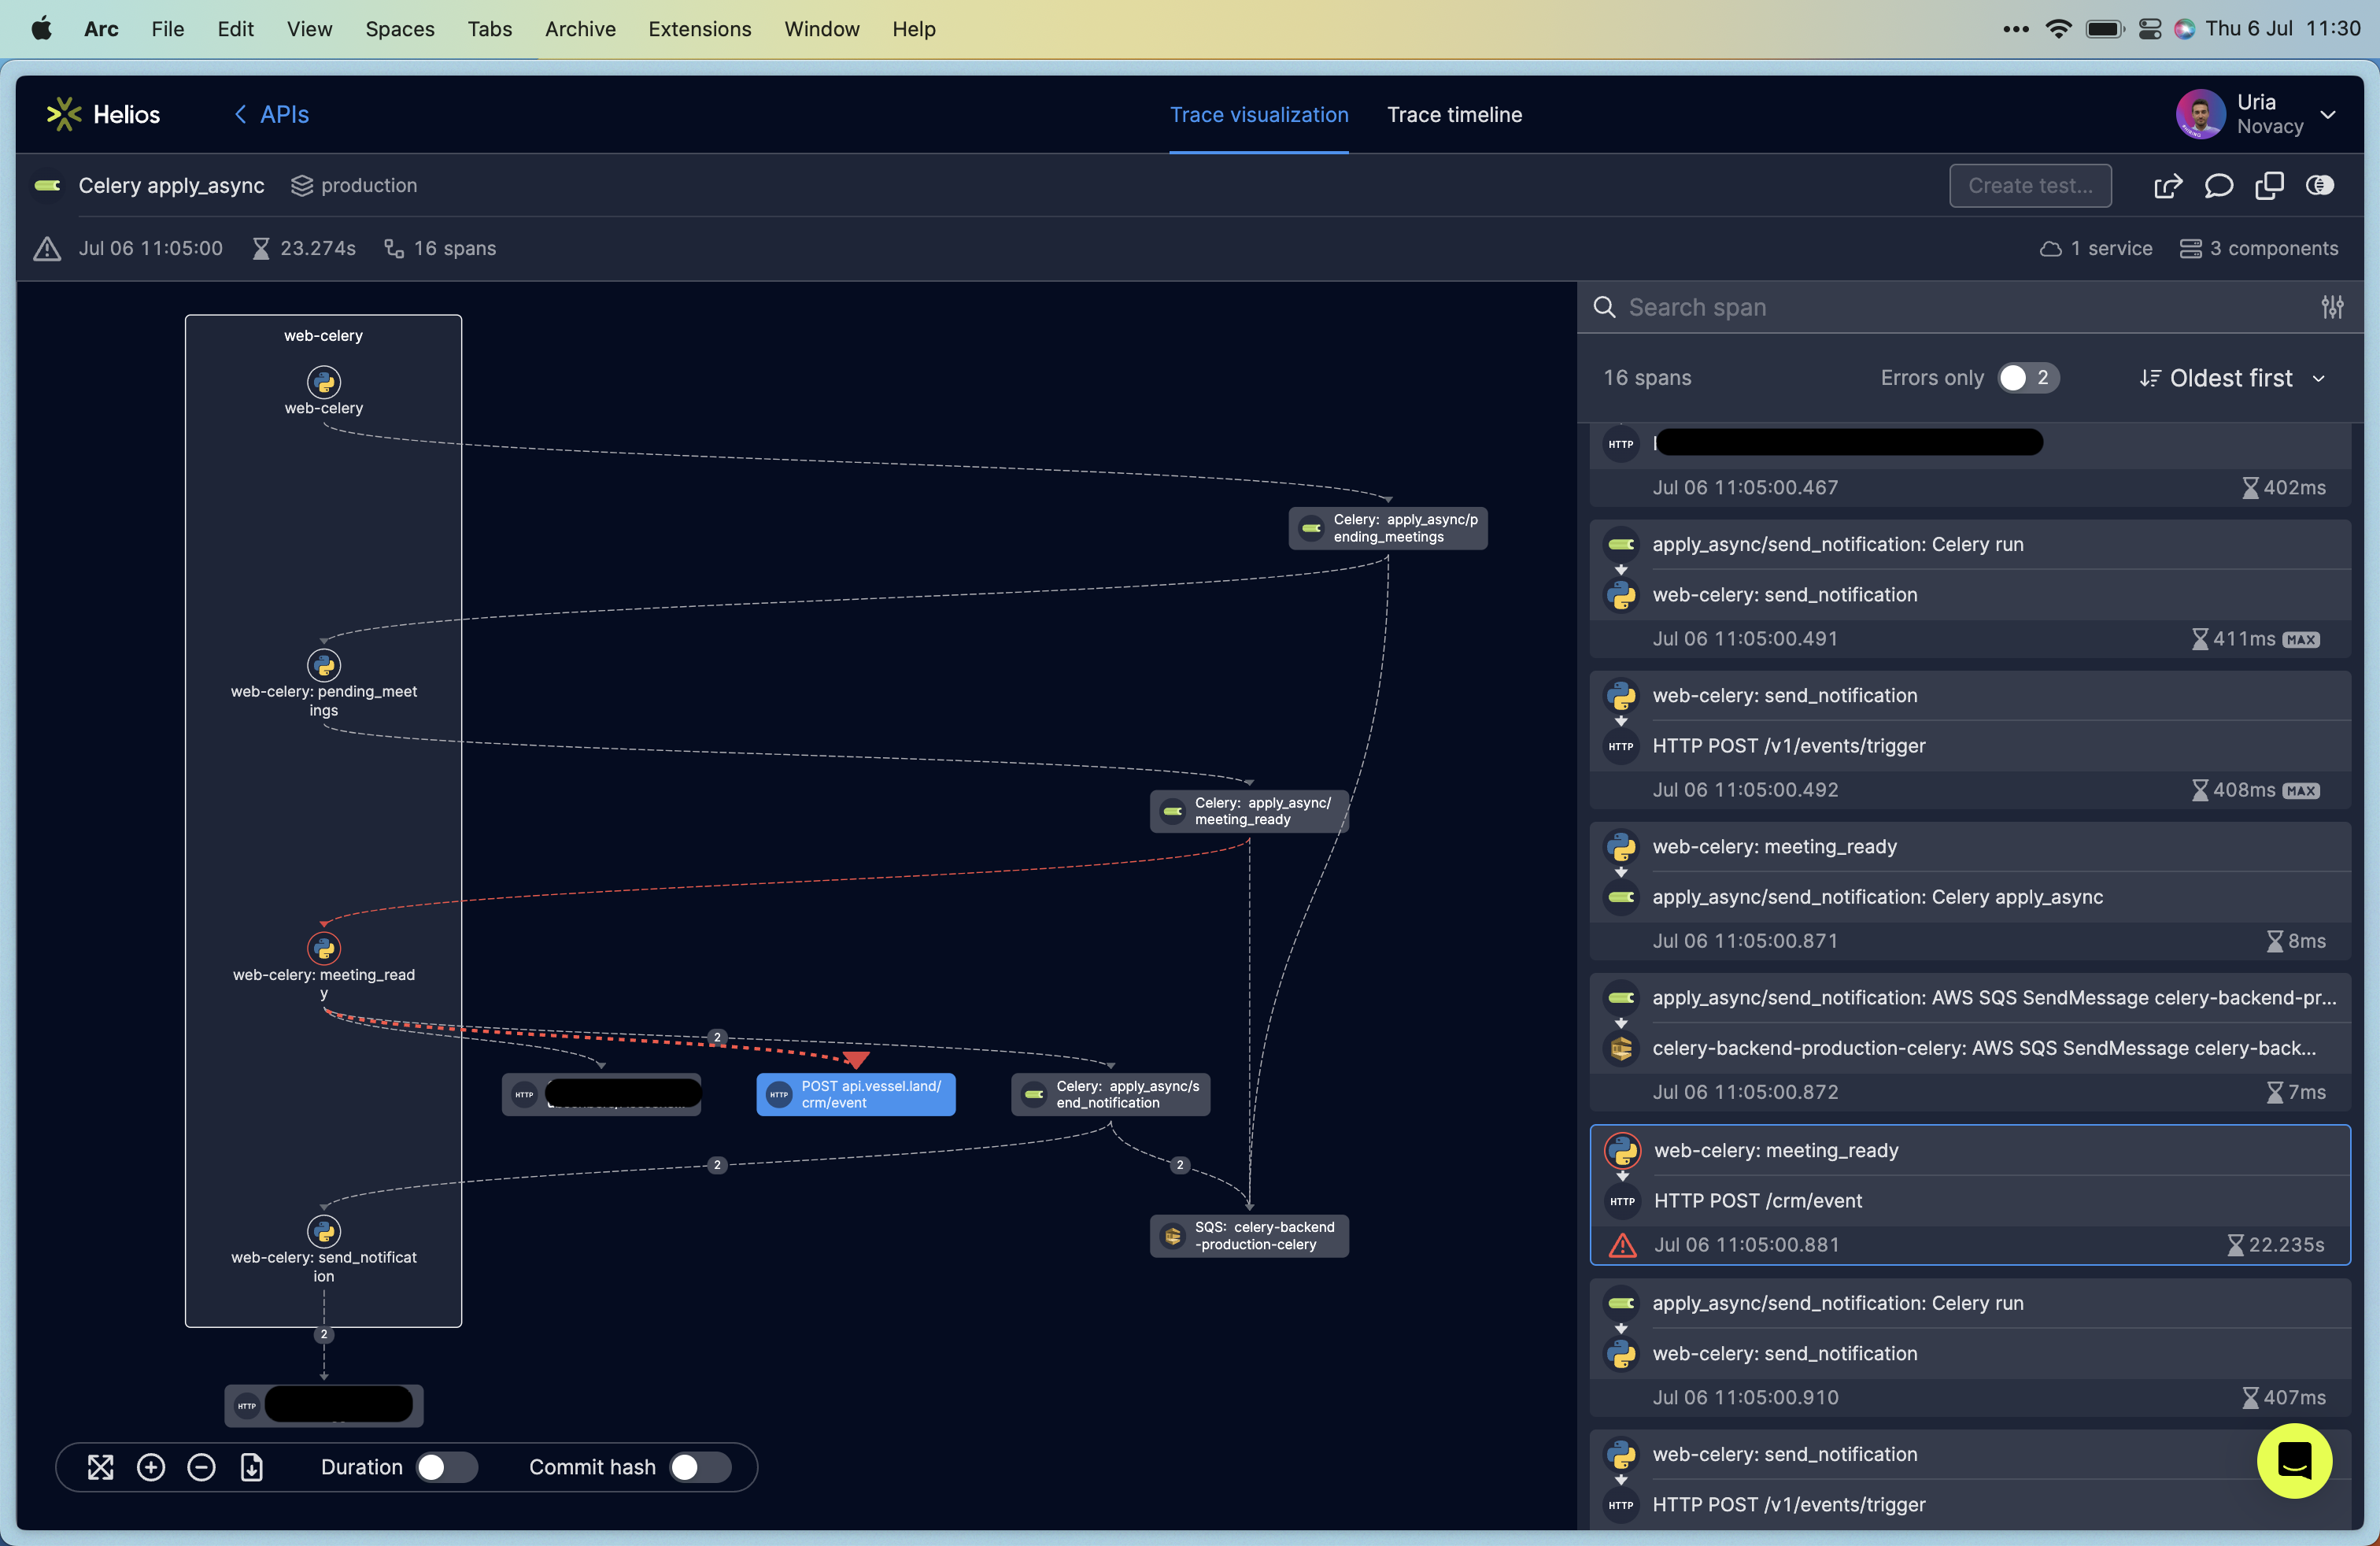
Taking a deeper look, the team can clearly see where the flow failed. With this visibility, debugging took only 10 seconds rather than an hour.
“With Helios, our team achieved remarkable results – 90% reduction in troubleshooting time and an impressive 80% improvement in performance. The user-friendly interface allows us to easily reproduce issues, and their exceptional support team proves they are true product masters. We plan to extend the use of Helios to any future architecture and service expansion, solidifying its place as an invaluable asset in our operations.” Uria Franko, CTO, Novacy.
Thanks, Uria, for trusting us with your business-critical systems. We’re here to help you provide the best services and experience to your customers. Here’s to a long lasting relationship.


