

Salt Security had deployed OpenTelemetry but found it insufficient. So the company engineers evaluated Helios, which visualizes distributed tracing for fast troubleshooting.
My role as the Director of Platform Engineering at Salt Security lets me pursue my passion for cloud-native tech and for solving difficult system-design challenges. One of the recent challenges we solved had to do with visibility into our services.
Or lack thereof.
Initially, we decided to adopt OpenTelemetry, but that didn’t give us everything we needed as we still had blind spots in our system.
Eventually, we found a solution that helped us zero in on service errors and slash the time it takes us to detect and resolve issues in half.
But let’s back up a bit.
70 Services and 50 Billion Monthly Spans Strong
At Salt Security, we have about 70 services, based on Scala, Go, and NodeJS, which generate 50 billion monthly spans.
Since 70 is no small number and neither is 50 billion, we needed assistance gaining visibility into the requests between the services.
The Need to See
Why did we need to see into our services?
1. At the macro level, we needed to monitor and identify problems after making changes in our system. For example, we needed to detect filters, anomalies, and any other signals of problematic flows.
2. At the micro level, we needed to be able to zero in on the causes of any problem we identified. For example, errors, slow operations, or incomplete flows, whether they support gRPC or Kafka operations, as well as their communication with databases.
To be clear, when we say “visibility” we mean a deep level of granularity at the payload level. Because just one single, slow query in the database might slow down the entire flow, impacting our operations and customers.
Gaining this visibility proved to be a tough nut to crack. Not only because of the sheer number of services and spans, but also due to the complexity of some flows.
For example, one single flow might involve as many as five services, three databases and thousands of internal requests.
Attempt #1: OpenTelemetry and Jaeger
Naturally, our first go-to was OpenTelemetry with our own Jaeger instance.
This amazing open source collection helps make capturing distributed traces and metrics from applications and infrastructure easy. The SDKs, the Collector and The OpenTelemetry protocol (OTLP) enable gathering traces and metrics from all sources and propagating them with the W3C TraceContext and Zipkin’s B3 formats.
Here’s a high-level diagram of what the resulting OTel setup looked like:
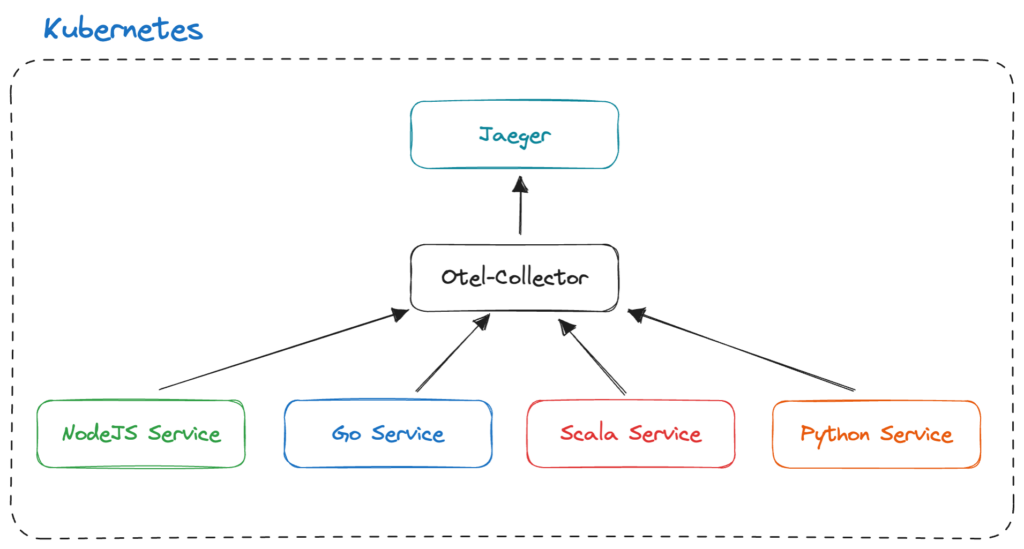
As you can see, we used the OTel collector to gather, process and move data from our services. Then, the data was propagated to another open-source tool: Jaeger. Jaeger was used for viewing the data.
Jaeger is fantastic, but it fell short of meeting our needs. We weren’t able to cover the critical parts of our system, leading to blind spots when we encountered errors.
Hello, Helios
That’s when we discovered Helios. Helios visualizes distributed tracing for fast troubleshooting. We chose Helios over other solutions because it answers both our macro and micro-level needs, and is especially incredible at the micro level.
Helios treats backend services, like databases and queues, and protocols, such as gRPC, HTTP, Mongo queries, and others, as first-class citizens. The data is formatted according to what it represents.
For example, a Mongo query will be shown firsthand when looking at a Mongo DB call, with JSON formatting. An HTTP call will be separated into a header and a body. A Kafka topic publishing or consuming a message will show the header and payload separately. This visualization makes it extremely easy to understand why the call or query is slow.
Helios also provides super-advanced support for cloud and third-party API calls. When it comes to Kafka, Helios shows the list of topics it picked up. For AWS, Helios shows the list of services in use, and they are highlighted when services use them.
In addition, Helios folks came up with an entire testing strategy based on traces! We can generate tests in a single click when looking at a specific span. There are also many other fantastic features, like advanced search, previews of flows in search results, error highlighting of traces that weren’t closed, and so on.
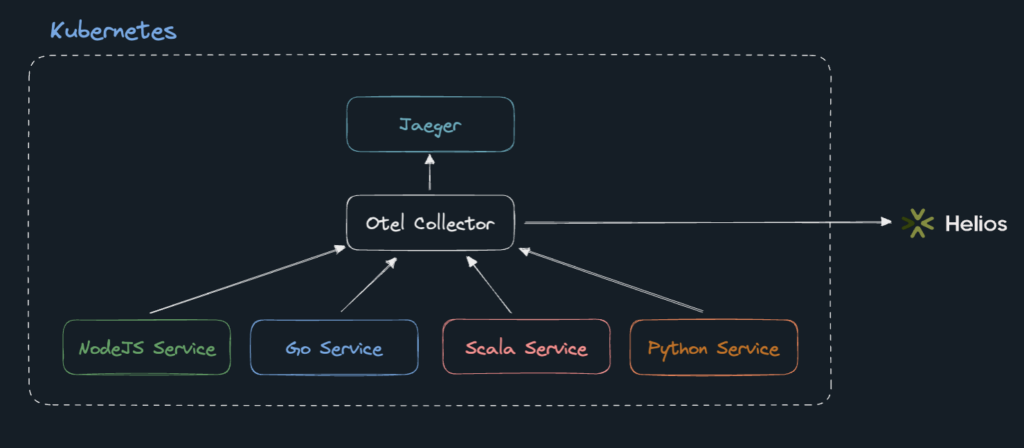
Our Helios setup is made up of:
- An OTel collector running on our Kubernetes cluster.
- The Helios SDK, which is used by each service in any language, and wraps the OTel SDK.
- Two pipelines:
- Between the OTel collector and Helios.
- Between the OTel collector and Jaeger, with a one-day retention. (We’re using a sampling of 3% when we send spans to Helios and a much higher sampling rate that is sent to Jaeger, but with much lower retention — for development purposes).
- Probability sampling for spans sent to Helios is at approximately 3%.
The Proof Is in the Pudding
The transition to Helios as an additional layer on top of OpenTelemetry proved successful. We use Helios daily when making changes in our system or when we’re trying to identify the source of an issue.
In one case, we used Helios to identify an erroring Span that occurred when a NodeJS service using the AWS SDK was timing out on requests to S3. Thanks to Helios, we were able to identify the issue and quickly fix it.
In another case, one of our complicated flows was failing. The flow involves three services, three databases, Kafka and gRPC calls. However, the errors were not being propagated properly and logs were missing. With Helios, we could examine the trace and understand the problem end-to-end immediately.
One more thing we like about Helios is its UI. which presents the services involved in each flow.
Here’s what that complicated flow looks like in Helios:
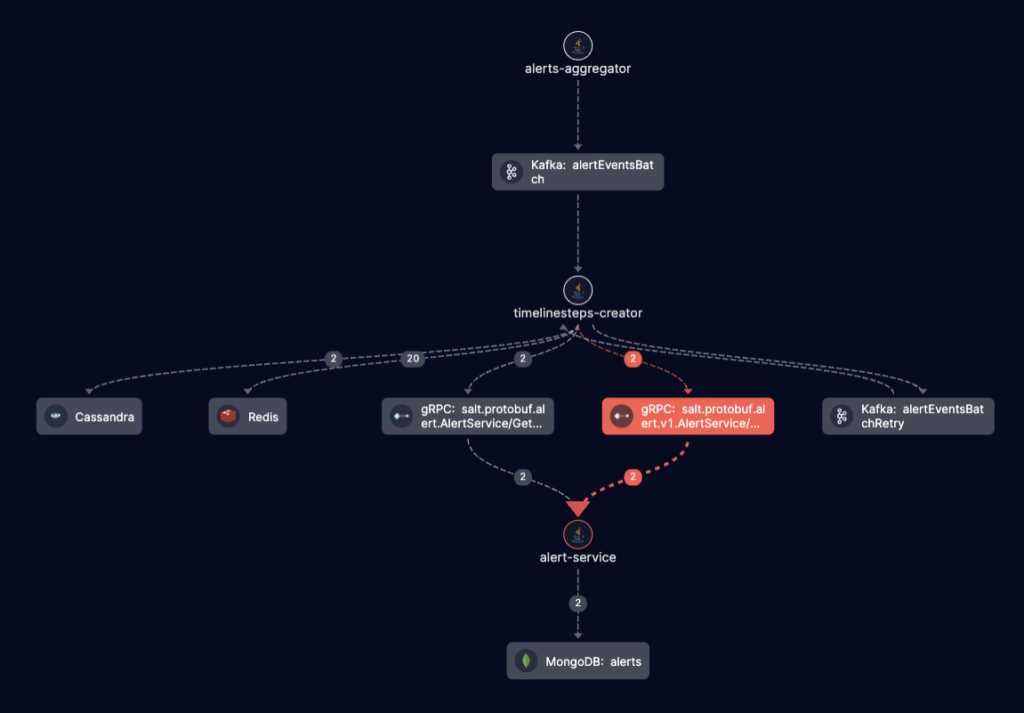
Simple and easy to understand, right?
Closing Remarks
We’re all familiar with the challenges of microservices and how blind we are when an error occurs. But while we’re flooded with tools for understanding that there’s a problem, we were missing a tool that could help us understand the exact location of the problem.
With Helios, we can see the actual queries and payloads without having to dig through span metadata. Their visualization significantly simplifies root cause analysis.
I highly recommend Helios for troubleshooting errors.
About the writer:
Eli Goldberg is a Cloud Native enthusiast, a fan of System Design, architecture, and patterns that make your life simple. With over 15 years of experience, Eli is eager to hear and share stories of success and failure. Eli currently leads the Platform Engineering group at Salt Security.


