

Unlocking the Full Potential of Kubernetes: Revolutionize Your Monitoring with OpenTelemetry
Organizations increasingly deploy and manage their applications using Kubernetes, which has emerged as the de facto standard for container orchestration. Monitoring these resources becomes critical for ensuring that the applications running on the platforms remain healthy.
However, monitoring is significantly complicated by the dynamic Kubernetes environments, where applications are continuously scaled, deployed, and updated since traditional techniques that rely on agents or polling will not work in Kubernetes environments due to their inability of not being able to keep up with the pace of change and the distributed nature of the architectures.
The failure to keep up and provide real-time monitoring capabilities results in increased Mean Time To Resolution (MTTR). This significantly impacts the overall availability and performance of the applications, leading to a negative impact on the business itself.
Administrators and engineering teams rely on the innovative approach of using OpenTelemetry to monitor the Kubernetes environments to get around these drawbacks of traditional monitoring solutions. With OpenTelemetry, administrators can use a standard way to collect, process, and export telemetry data.
Hence, this article will dive into how implementing OpenTelemetry tracing in Kubernetes environments can help organizations gain real-time visibility into their applications and infrastructure performance while helping reduce MTTR by quickly identifying and resolving issues.
Related: OpenTelemetry – a full guide
The challenge with monitoring K8s
Monitoring traditional metrics with a Kubernetes environment will only provide organizations with limited visibility into the workings of the applications running on the Kubernetes environments. While collecting the default metrics, such as error rate, CPU, memory, etc., from the Kubernetes environments, organizations may need help managing specific metrics that indicate the latency, error rates, and throughput for individual application components or services; This will result in an incomplete understanding of the overall environment.
The need to monitor distributed applications goes beyond the traditional monitoring that can be accomplished by simply monitoring Kubernetes observability data. Various metrics specific to the application and environments must be collected to give organizations an in-depth understanding of the distributed applications.
OpenTelemetry allows the collection of these monitoring parameters from the application and Kubernetes environments, including easily distributed tracing, enabling organizations to identify and diagnose issues quickly.
Why is it essential to monitor K8s with OpenTelemetry?
Even though there are many approaches to monitoring Kubernetes, using OpenTelemetry provides far superior benefits compared to traditional monitoring options. Nevertheless, completely ignoring the monitoring could have a horrendous impact on the performance and availability aspects of the applications that would affect the business.
The lack of monitoring would cause the organization to have a much higher Mean Time To Resolution (MTTR) since the organizations would not have the necessary metrics to effectively and efficiently identify the root cause of issues within the applications. Monitoring critical components within a Kubernetes cluster may significantly reduce the MTTR.
Organizations may run into several issues without adequate monitoring of their Kubernetes environments, such as Kubernetes pod crash loops, persistent volume failures, and job failures. All these issues lead to significant downtimes and performance issues of the Kubernetes environments and the applications running on these resources.
Another critical aspect that needs to be improved with adequate monitoring is the end-to-end visibility necessary to identify dependencies amongst the distributed components of the applications and the infrastructure that runs these services. Without a comprehensive view of the application, organizations cannot analyze and drill down into the issues that may arise, thus increasing the complexity of narrowing down the root cause and increasing the Mean Time To Resolution (MTTR).
Monitoring also lays the foundation for a sought-out aspect of anomaly detection. This allows organizations to identify behaviors that do not conform to the normal operations within the applications. This becomes important when attempting to place any anomaly that could hurt the application’s performance.
Additional benefits provided by OpenTelemetry ensure that the challenges caused by the inadequate implementation of monitoring are minimized, and teams can utilize these features to their full extent by resolving issues such as increased MTTR times, limited visibility, etc.
Best practices for monitoring K8s
Even though monitoring Kubernetes depends on several criteria specific to the application and organization, there are best practices that allow organizations to get the most out of their monitoring efforts.
Some of the most commonly looked at best practices for monitoring Kubernetes include:
- Using a dedicated tool: This refers to using a tool that is specialized for providing insight into Kubernetes cluster health and performance, including resource utilization, service availability, and container metrics.
- Monitoring cluster components: It is not enough to monitor only the applications running on the Kubernetes environment but also the Kubernetes cluster components. This includes the capability to monitor the Kubernetes API server, etc., and other control plane components.
- Collecting metrics, logs, and traces: Logging is considered one of the most fundamental aspects of implementing adequate monitoring. Collecting metrics and traces adds to the collected logs and further enhances the visibility into the applications. To provide advanced monitoring capabilities, it is recommended to use a centralized solution that can collect metrics, logs, and traces from all Kubernetes components and applications running on the cluster.
- Setting up alerts: After collecting the appropriate metrics from all the application and Kubernetes components, organizations can set up alerts based on applicable thresholds to notify users of anomalies.
- Using dashboards: Multiple methods of visualizing the collected metrics, logs, and traces exist. However, dashboards allow users a customizable visualization to identify anomalies within the applications and the Kubernetes environment. Dashboards can provide near-real-time information on resource utilization, service availability, and other critical metrics.
Key metrics to look for
While collecting and analyzing metrics from within a Kubernetes environment, various metrics must be considered. However, the following may give an organization a good foundation for the basics that need to be collected.
- Node Metrics: These metrics offer details on the performance and resource use of individual cluster nodes, including CPU, memory, and network usage.
- Pod Metrics: These metrics, such as CPU, memory, and network usage, provide information about the resource use and operation of the pods running on the nodes.
- Container Metrics: These metrics offer details on the performance and resource use of the individual containers running within the pods, including CPU, memory, and network usage.
- API Server Metrics: These metrics, which include request latency, response time, and error rate, give details about the functionality and availability of the Kubernetes API server.
- Etcd Metrics: These metrics, which include disk usage, response time, and error rate, give details about the operation and condition of the etcd cluster.
Implementing OpenTelemetry
Implementing OpenTelemetry to monitor a Kubernetes environment would allow organizations to collect and analyze various metrics that can be correlated with other metrics collected from different parts of the application to understand the overall application performance better.
Installing OpenTelemetry to monitor a Kubernetes environment can be done in 4 easy to follow steps:
- Install the OpenTelemetry collector
- Configure the OpenTelemetry collector
- Enable OpenTelemetry instrumentation in your Kubernetes applications
- Send data to your preferred backend
Install the OpenTelemetry agent
The OTel agent can be set up in your Kubernetes cluster as a DaemonSet. This will guarantee that the agent runs on every node in the cluster. To install the agent, issue the following command:
kubectl apply -f https://github.com/open-telemetry/opentelemetry-operator/releases/latest/download/opentelemetry-operator.yaml
The OpenTelemetry operator can also be installed using a Helm chart.
Configure the OpenTelemetry agent
You must configure the OTel collector to gather telemetry data from your Kubernetes cluster. You can create a configuration file in YAML format and mount it as a volume in the agent pod. The exporters, receivers, and processors you intend to use should all be listed in the configuration file. For more details on configuring the agent, consult the OTel documentation.
You can send the gathered telemetry data to your preferred backend once the OTel agent has been set up and the OTel SDK has been incorporated into your application code.
Several backends, including Prometheus, Jaeger, and Zipkin, are supported by OTel.
receivers:
  otlp:
    protocols:
      grpc:
exporters:
  prometheus:
    endpoint: "localhost:8888"
  jaeger:
    endpoint: "http://jaeger:14268/api/traces"
service:
  pipelines:
    traces:
      receivers: [otlp]
      processors: []
      exporters: [jaeger, prometheus]
Enable OpenTelemetry instrumentation in your Kubernetes applications
You must incorporate the OTel SDK into your application code to gather telemetry data from your Kubernetes applications. To instrument your application, you can use one of the OTel language-specific operators (like Java, Python, or .Net); it is essential to note that you can enable auto-instrumentation for some specific languages).
Using OpenTelemetry to Monitor Kubernetes
After setting up the OTel agent and integrating the OTel SDK into your application code, you can send the gathered telemetry data to your preferred backend. Prometheus, Jaeger, and Zipkin are just a few of the backends that OTel supports.
The OpenTelemetry Operator makes it simple to deploy OTel in Kubernetes. You can deploy and manage OTel components in your Kubernetes cluster using the operator, a tool native to the Kubernetes platform. With the operator, you can set up the OTel collector to gather telemetry data from your Kubernetes applications and export that data to your preferred backend. You can deploy the OTel collector as a deployment or a daemon set.
Tools to Use to Monitor K8s
OpenTelemetry is an effective tool for Kubernetes monitoring that offers valuable insights into the functionality and behavior of your Kubernetes applications. Other tools can be used in addition to OpenTelemetry to enhance its benefits.
The following tools are some of the most commonly used tools when monitoring Kubernetes environments:
- Prometheus
- Grafana
- Jaeger
- Helios
Monitoring Kubernetes with Prometheus
In Kubernetes environments, Prometheus is a well-liked monitoring tool frequently used. It makes monitoring and troubleshooting your Kubernetes cluster simple by offering a robust query language and various visualization options.
The following configuration shows an example of a Kubernetes config to deploy Prometheus in your cluster.
apiVersion: monitoring.coreos.com/v1
kind: Prometheus
metadata:
  name: prometheus
spec:
  serviceAccountName: prometheus
  serviceMonitorSelector:
    matchLabels:
      app: sample-app
  resources:
    requests:
      memory: 400Mi
  ruleSelector:
    matchLabels:
      prometheus: k8s
  alerting:
    alertmanagers:
    - static_configs:
      - targets:
        - alertmanager:9093
Monitoring Kubernetes with Grafana
Popular visualization tool Grafana integrates well with Prometheus. It offers a wide variety of visualization options and enables you to build personalized dashboards that give you a detailed understanding of how your Kubernetes cluster is operating.
apiVersion: v1
kind: Service
metadata:
  name: grafana
  namespace: monitoring
  labels:
    app: grafana
spec:
  ports:
  - port: 3000
    targetPort: 3000
    protocol: TCP
  selector:
    app: grafana
---
apiVersion: apps/v1
kind: Deployment
metadata:
  name: grafana
  namespace: monitoring
spec:
  replicas: 1
  selector:
    matchLabels:
      app: grafana
  template:
    metadata:
      labels:
        app: grafana
    spec:
      containers:
      - name: grafana
        image: grafana/grafana:latest
        ports:
        - containerPort: 3000
        volumeMounts:
        - name: grafana-data
          mountPath: /var/lib/grafana
      volumes:
      - name: grafana-data
        persistentVolumeClaim:
          claimName: grafana-data
Monitoring Kubernetes with Jaeger
Jaeger is an open-source tracing tool with distributed tracing capabilities similar to OTel. It offers a variety of visualization options that make it simple to comprehend the flow of requests through your Kubernetes cluster and supports various tracing formats, including OTel.
apiVersion: jaegertracing.io/v1
kind: Jaeger
metadata:
  name: simple-prod
spec:
  strategy: allInOne
  allInOne:
    image: jaegertracing/all-in-one:latest
    options:
      log-level: debug
Helios – Monitor K8s with OTel and get advanced visualization and granular error data
Helios is a dev platform for observability and monitoring that can be used to monitor Kubernetes environments. Its advantages include the easy work with OpenTelemetry and a few critical elements that other tools do not have: It provides alerts that assist you in quickly identifying problems and real-time visibility into your Kubernetes cluster and rich visualizations. Helios is a complete monitoring tool for Kubernetes environments because it can also monitor the infrastructure and applications that run on Kubernetes.
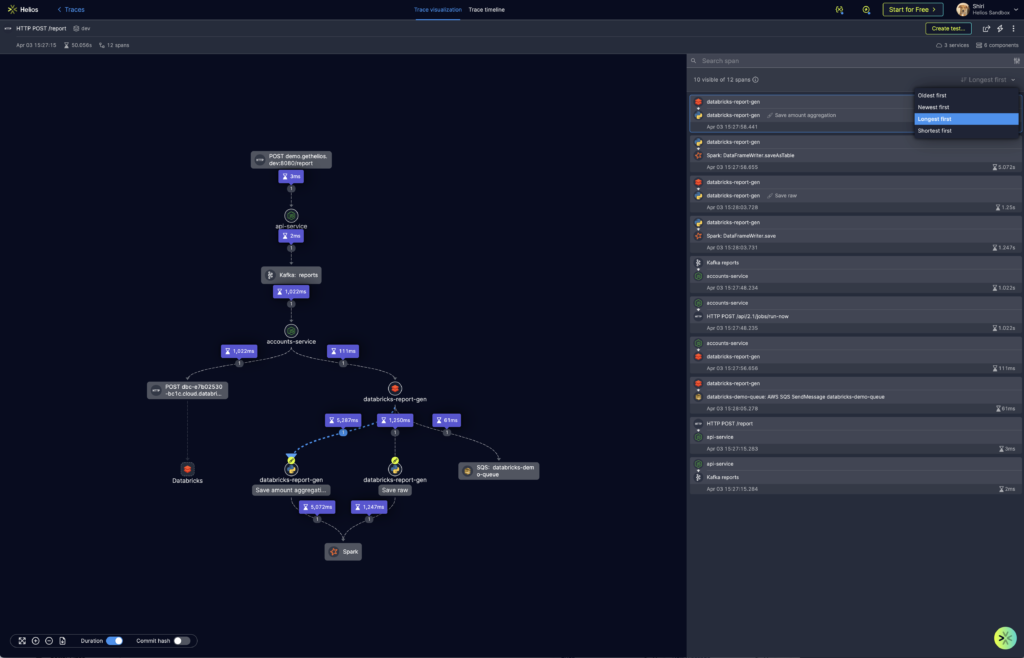
in the image: Trace visualization and granular data as seen in Helios
Trace visualization by Helios:
Conclusion
In conclusion, monitoring Kubernetes is essential for ensuring the performance, dependability, and availability of your Kubernetes-based applications. OpenTelemetry offers a robust framework for monitoring Kubernetes environments using distributed tracing, metrics, and logging.
You can improve the performance of your applications by adhering to best practices and utilizing the appropriate tools, such as OpenTelemetry and Helios, to gain real-time visibility into your Kubernetes clusters.
A robust monitoring strategy is crucial now more than ever as Kubernetes continues to grow in popularity. You can avoid potential problems and ensure your Kubernetes environment runs smoothly by implementing OpenTelemetry and other monitoring tools.


