


A developer shares real-world examples of how bringing together metrics, logs and traces makes Lambda monitoring a lot more effective and helps reduce the time it takes to identify root cause of production issues.
Observability & monitoring can be challenging when it comes to distributed applications, serverless architectures being a typical examples of that. As with any other service that we run, we need to understand how our Lambda functions are executed, how to identify issues, and how to optimize performance. However, monitoring Lambdas is different than monitoring any other service: if for a traditional service we care about basic metrics such as CPU, memory consumption, and error rates – in Lambda functions, since they are serverless, we need to rely on other metrics to get a holistic view. We want to follow the number of erroneous invocations and whether the Lambda crashed due to timeouts or out of memory errors. This makes monitoring Lambda functions inherently different. In order to achieve a high standard of Lambda observability with low mean-time-to-resolution (MTTR), we need to collect and analyze Lambda-specific metrics, logs, and traces generated during the run cycles of our Lambda functions.
The key to success in monitoring our Lambdas is the ability to connect all pillars (or signals) of observability – metrics, logs, and traces – together in one place, giving us a full picture that makes it much easier to understand the root cause of a problem. Helios gives us this ability using both SDK installation and server-side integration: instrumenting AWS Lambda functions with OpenTelemetry for E2E Lambda tracing, and integrating directly with the AWS account to provide the relevant Lambda metrics and logs.
In this blog post I walk through how we apply the three pillars of observability to Lambdas to improve monitoring.
I describe a couple of use cases in which we combine metrics and distributed tracing data to fix production issues in just a few clicks and in less than five minutes.
Achieving optimal Lambda observability with metrics, logs and traces
Helios supports instrumentation in different approaches – it can be enabled by using a package which is added to Lambda, or using a Lambda layer. Both ways require adding relevant environment variables but do not require any code changes.
After installing and integrating Helios into your AWS account, you get the three pillars of (Lambda) observability – metrics, logs and traces – in a single platform, all interconnected with each other. The traces are collected by the OpenTelemetry (OTel)-based Helios SDK, installed across all Lambdas and microservices. Leveraging context propagation, instrumented invocations of Lambdas are collected and displayed as part of the E2E applicative flow captured in a trace. The SDK also collects basic metrics. Other Lambda-specific metrics, as well as logs, are pulled from CloudWatch using the AWS account integration, and are available through Helios together with the traces of the Lambda invocations.
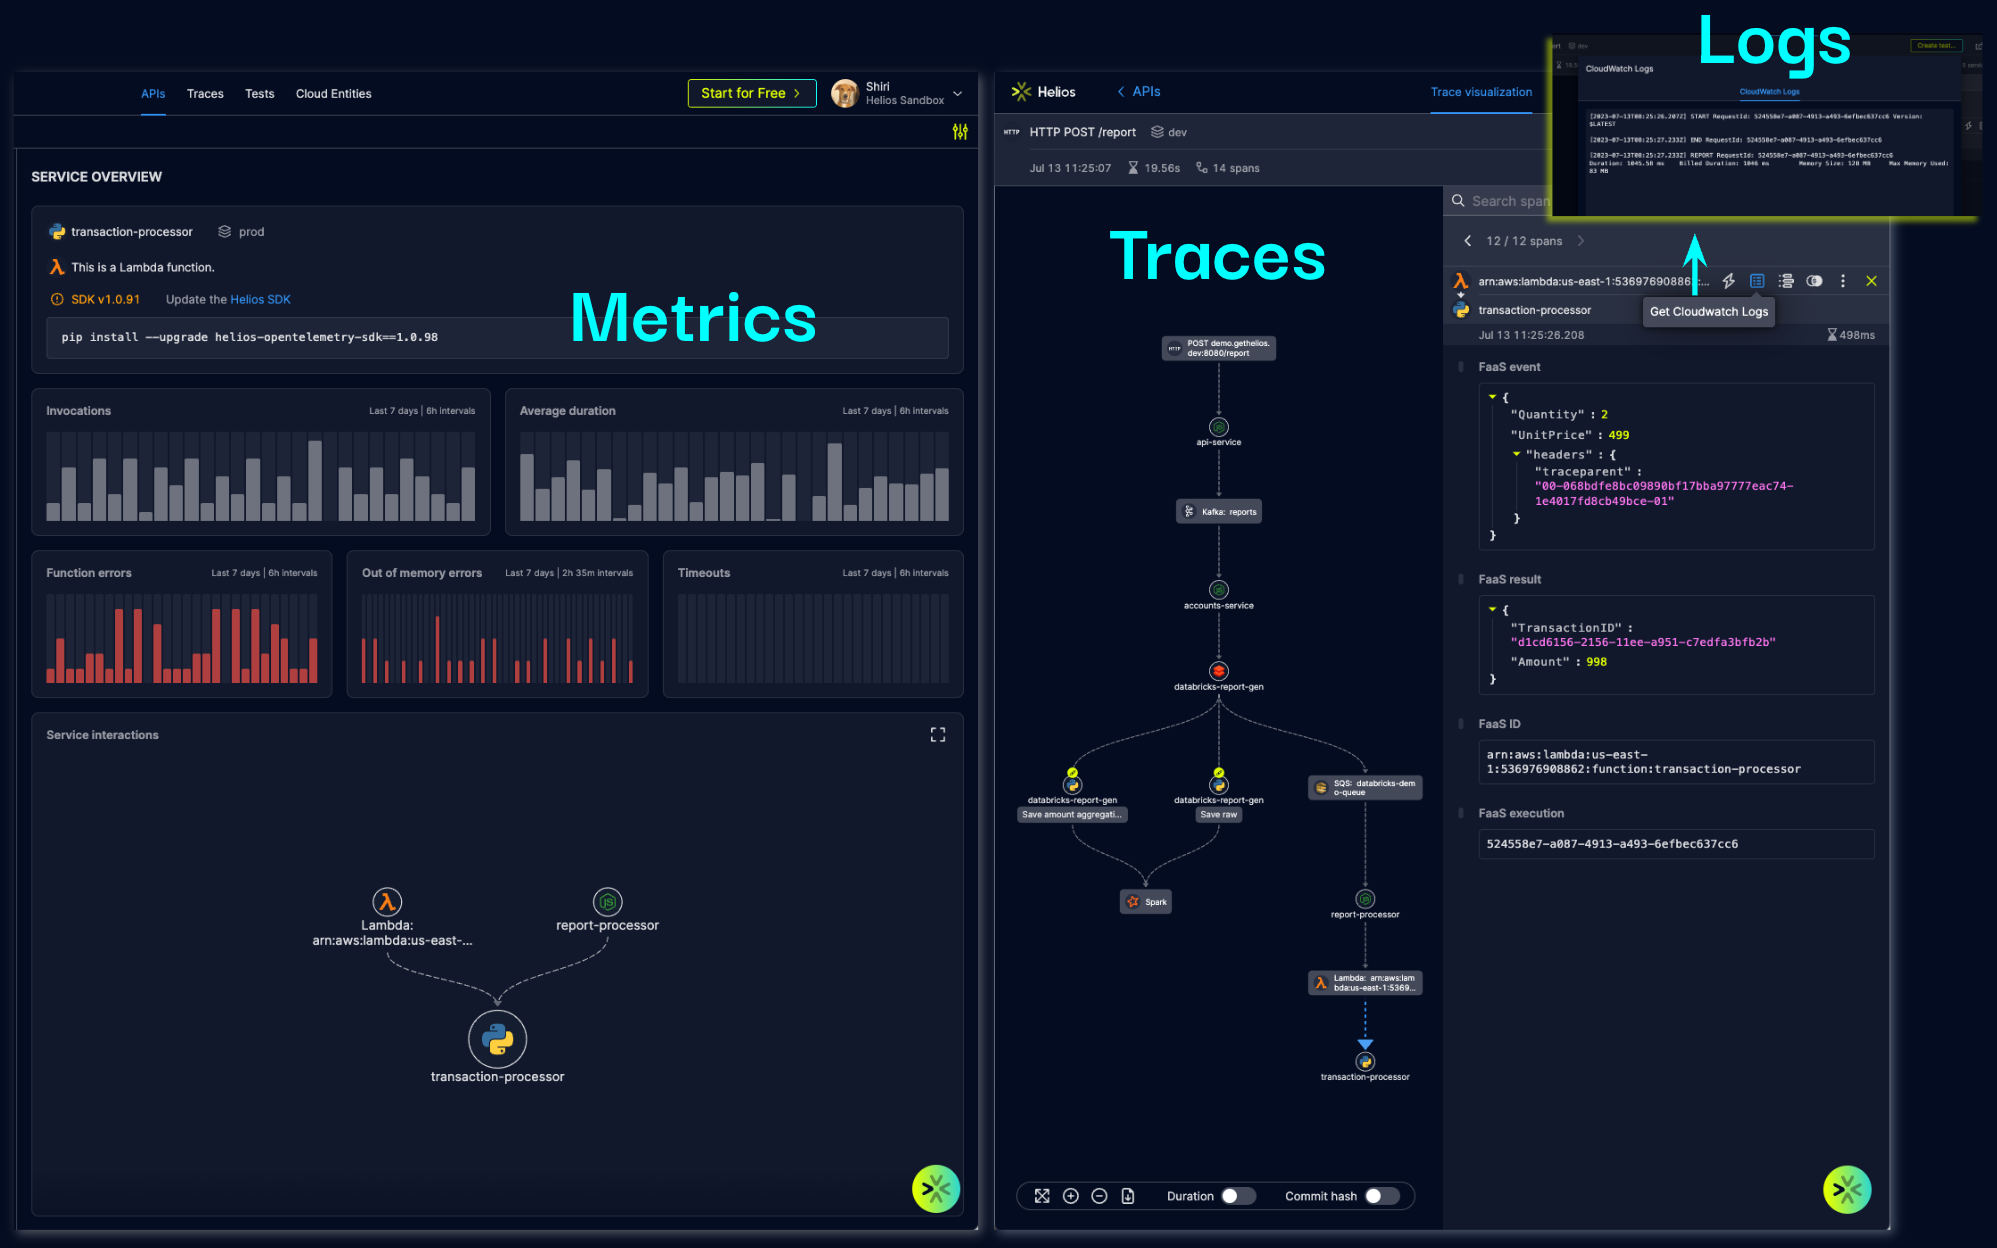
For every Lambda function, Helios provides a dashboard with an overview which includes all the latest invocations and errors. The overview also provides a service map showing the connectivity between the Lambda function and other microservices or any other component in the architecture of your application – based on the actual traces collected by the Helios SDK during the invocations of the Lambda function. There’s also a status page providing an overview of all Lambda functions across the distributed application.
Let’s look at a couple of real use cases I came upon where I had to troubleshoot a Lambda-related issue, and how I used Helios to solve it.
Example #1: Trace-based alerts
In our system, we have a Lambda function LambdaAuthorizer which is used by the API Gateway for all incoming requests from our clients. Its role is to authenticate the requests and forward the authenticated requests down the pipeline and reject the invalid ones. This function is very critical to our flow – if it fails, requests coming in from our customers are rejected and no data can be sent. Therefore I defined an alert (in Helios) on the Lambda function that notifies me of any type of error which occurred on this Lambda.
I started to receive alerts indicating that there are errors from this function. The alerts are routed to a dedicated Slack channel and contain a direct link to Helios into the trace that the alert matched on and it allows us to investigate the issue instantly.
When I looked at the trace, I saw right away that the requests to the account-service, against which the Lambda function validates the data, were taking too long because of a heavy load on that service. So, immediately I understood that I have to set a dedicated timeout period for the calls to the account-service and retry the call in case it hits the timeout.
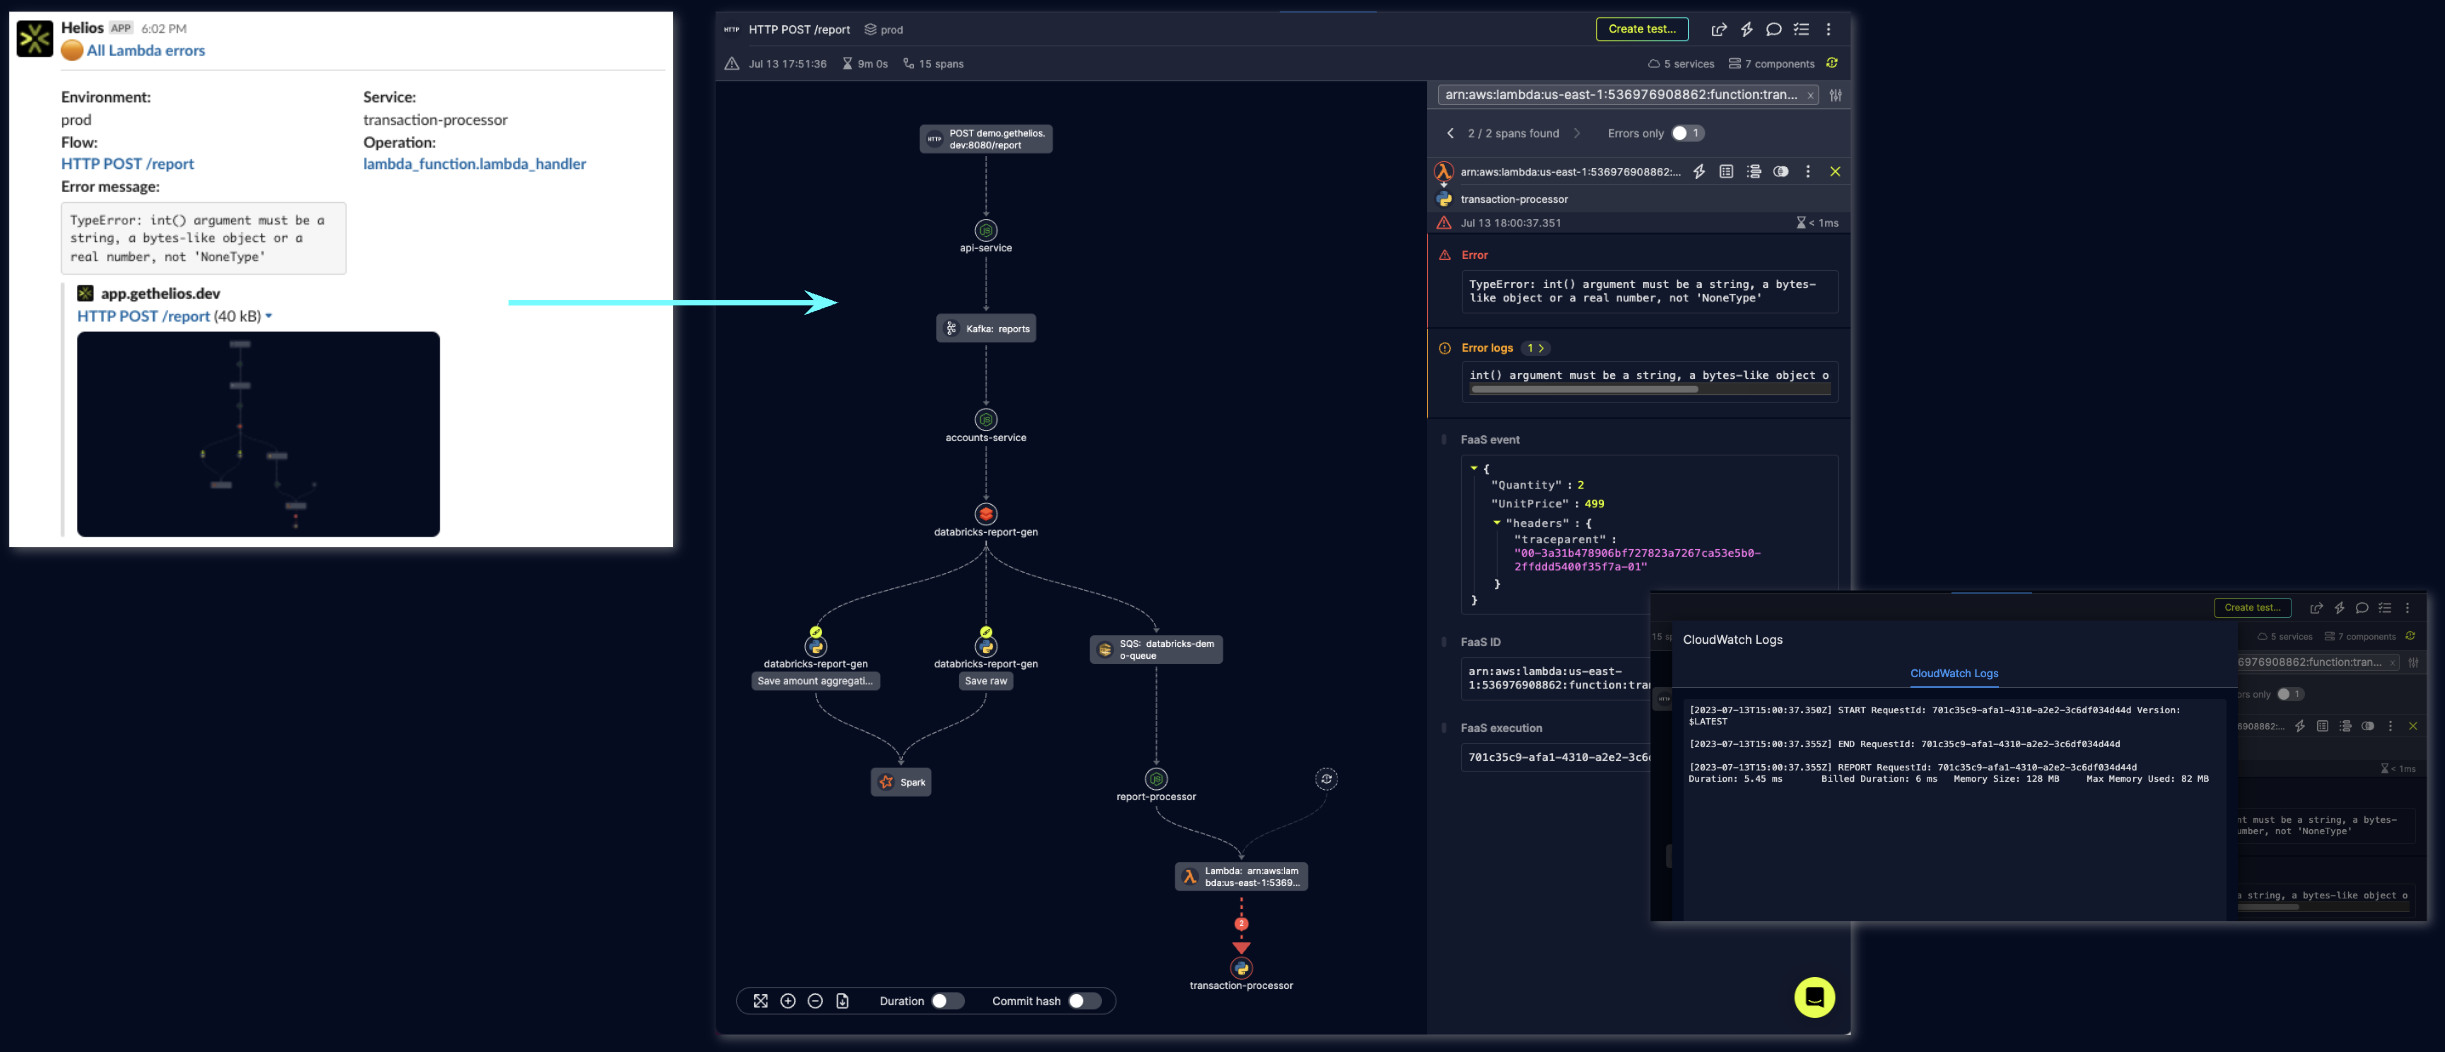
If logs were the only thing I had at my disposal, I would not have been able to see the long response times from the account-service as this data is mostly not part of the logs. With Helios’ observability features, I could see the responses on the trace and get to the root cause in seconds, saving precious time.
Example #2: Lambda error handling
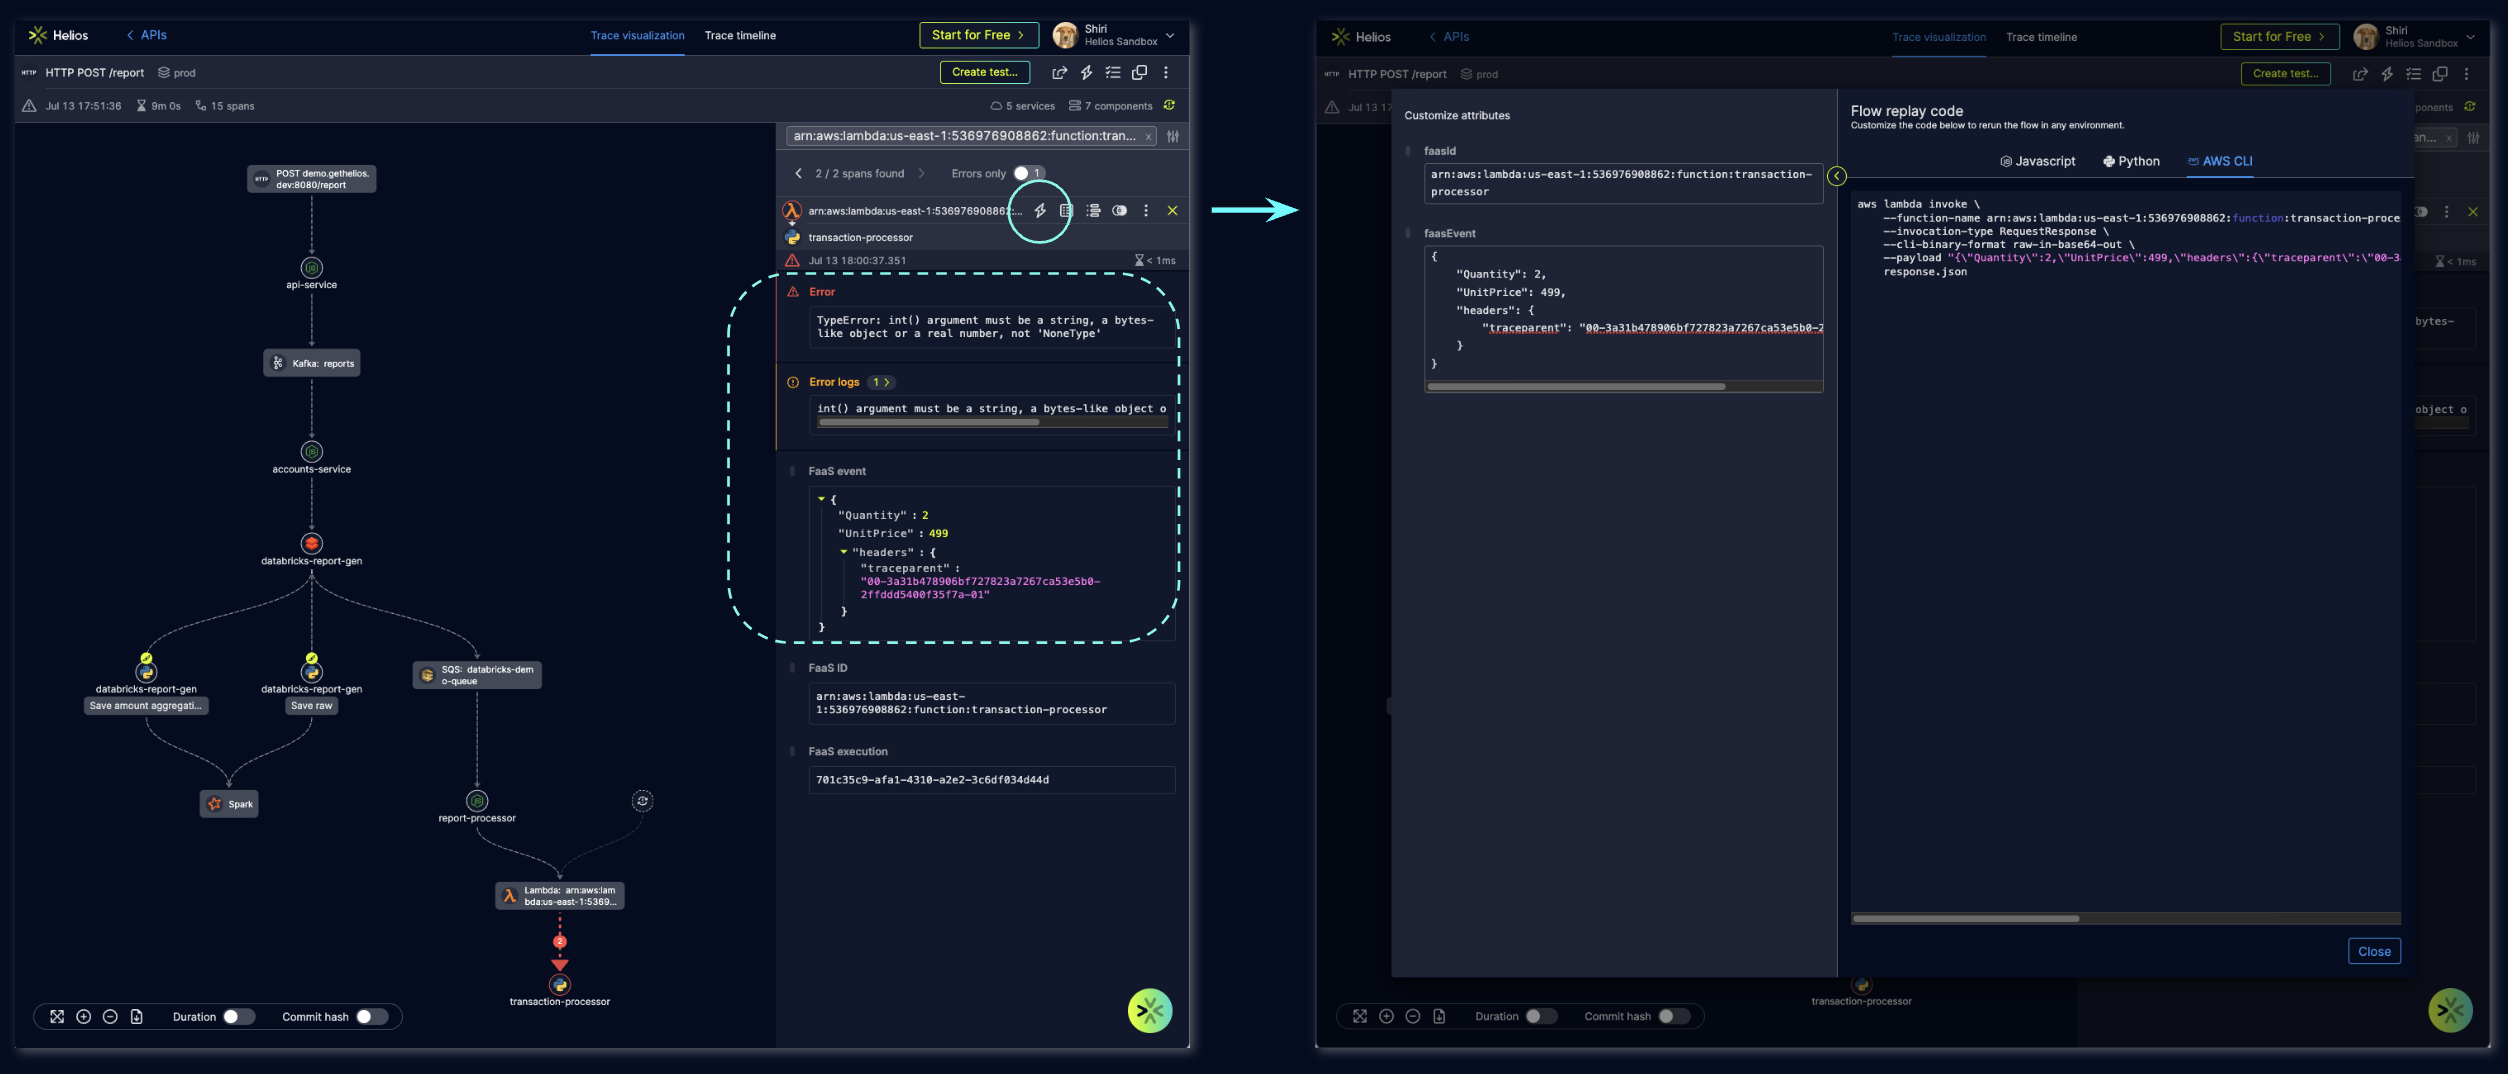
Another use case that I encountered is a Lambda function that kept on failing. The logs that were given from the Lambda were not indicative enough to help me figure out exactly what went wrong, except for the old known error log message. I did not have an alert configured on the function – if I did then our MTTR would likely have been much lower. So I went from the error log straight to the matching trace in Helios using the go_to_helios URL which is attached to the log – and right away I saw what went wrong.
The issue was failed requests to a 3rd party API: one environment variable was missing from the Lambda function and not populated right on the payload of the request to the 3rd party, resulting in a bad request error and failing our Lambda. The fact that the Helios SDK collects the payloads of the requests and responses – for Lambda functions too – allowed me to see the exact payload that was sent and failed. With the replay flow feature on this payload, I was able to reproduce the call and fail it again, and also to check my fix before deploying the code correction.
While we can get metrics and logs out of the box from AWS CloudWatch, it’s still difficult to understand the what’s happening and why. We have to look through tons of logs to find the error (like the classic needle in a haystack) and then figure out why.
Helios comes into play here to accelerate the process of finding errors and reduce MTTR. We deliver the applicative context – the context of the traces – through the instrumentation we conduct by virtue of being installed into the run cycles of the Lambdas. As we provide the applicative context from the request itself – together with the insights we get from the AWS integration – we can combine the metrics, logs and traces to make troubleshooting faster.
Conclusion
Combining the three pillars of observability – metrics, logs and traces – gives you the ability to monitor your distributed applications much more efficiently, and perform faster root cause analysis. Lambda monitoring & observability is no different, and by connecting instrumented traces with data from the server (in CloudWatch) it’s a lot easier to troubleshoot complex Lambda-related errors.
As a developer, having access to this data and context in a single easy-to-use place, and being able to inspect Lambda metrics with applicative end-to-end flows – it’s a game changer. This is one more way we at Helios aim to improve the developer experience – providing developers with the tools we developers need to drill down into errors in our system and fix them fast.
With Helios, developers can cut down MTTR, allowing us to focus on business-critical tasks that drive value for our customers.


