

Leveraging distributed tracing with advanced OpenTelemetry visualization, you can get instant visibility into bottlenecks in your application, so you can quickly and easily alleviate them.
As an engineer building a distributed application, every now and then I need to identify and analyze bottlenecks in our system. There can be several triggers for conducting a bottleneck analysis, for example:
- Prior to some planned architectural change, in order to get a better understanding of how changes might affect the application.
- As part of an optimization process for the application.
- As part of a broader root-cause analysis, in case of issues encountered or reported by users.
In this blog post I’ll share how I’ve been using our own product, Helios, and the power of distributed tracing for app monitoring, to help pinpoint bottlenecks in our system and resolve them fast.
To give an introduction to our product, Helios is a developer platform that provides actionable insight into your end-to-end application flows by adapting OpenTelemetry’s (OTel) context propagation framework to connect the dots. In my day-to-day work I use Helios to provide a single source of truth for how data flows through our entire application so I can understand and troubleshoot issues much faster.
Importance of bottleneck analysis in software
Finding and mitigating bottlenecks in software is important for several reasons:
- Performance. Bottlenecks degrade system performance and can make it unresponsive, or even crash.
- Maintainability and troubleshooting. Existing bottlenecks can mask undesired behavior in other parts of the system, making it harder to locate and handle other potential issues.
- Scalability. As the workload of any system increases, bottlenecks can become more pronounced and may prevent the system from meeting increased demand. In most modern cloud systems, trying to scale a system while not resolving bottlenecks will also have an increased impact on cost.
Identifying and eliminating bottlenecks early and easily will therefore make any system continuously perform better, significantly reduce cost in the long run, and improve user experience.
Why is identifying bottlenecks in distributed applications hard(er)?
To overcome bottlenecks in a system, it is, of course, important that we’re able to first identify them. In a synchronous, single-threaded, single-process system, this might not be such a daunting task. In a real-life scenario, though, where distributed applications often span multiple processes and threads, and involve asynchronous communication, this can be quite challenging.
In such applications, bottlenecks can occur in many different places at different times and due to many possible causes. There are a lot more I/O operations flying around, and different processes of the same application are usually allocated different amounts of resources, where a backlog can build up over time. Without the ability to go through the program execution step-by-step, it quickly becomes unmanageable and very hard to understand what’s going on.
Having some data already collected from the system – and having good visibility into it – is priceless at this stage. This is why developers are such fans of OTel, an emerging standard for application observability and distributed tracing across cloud-native and distributed architectures. At Helios, we build upon OTel to help alleviate many of the typical challenges associated with moving to and building microservices-based distributed architectures.
Example: Using E2E trace visualization to identify slow operations and potential bottlenecks
In the Helios platform, apart from enabling users to collect and store traces, we allow them to upload their own traces for visualization, in case they’ve already been using OTel and want to get better visibility into it. A part of the application can therefore accept files uploaded by users, process and analyze them in real time, and give back a visualized response.
1. Identifying the bottleneck
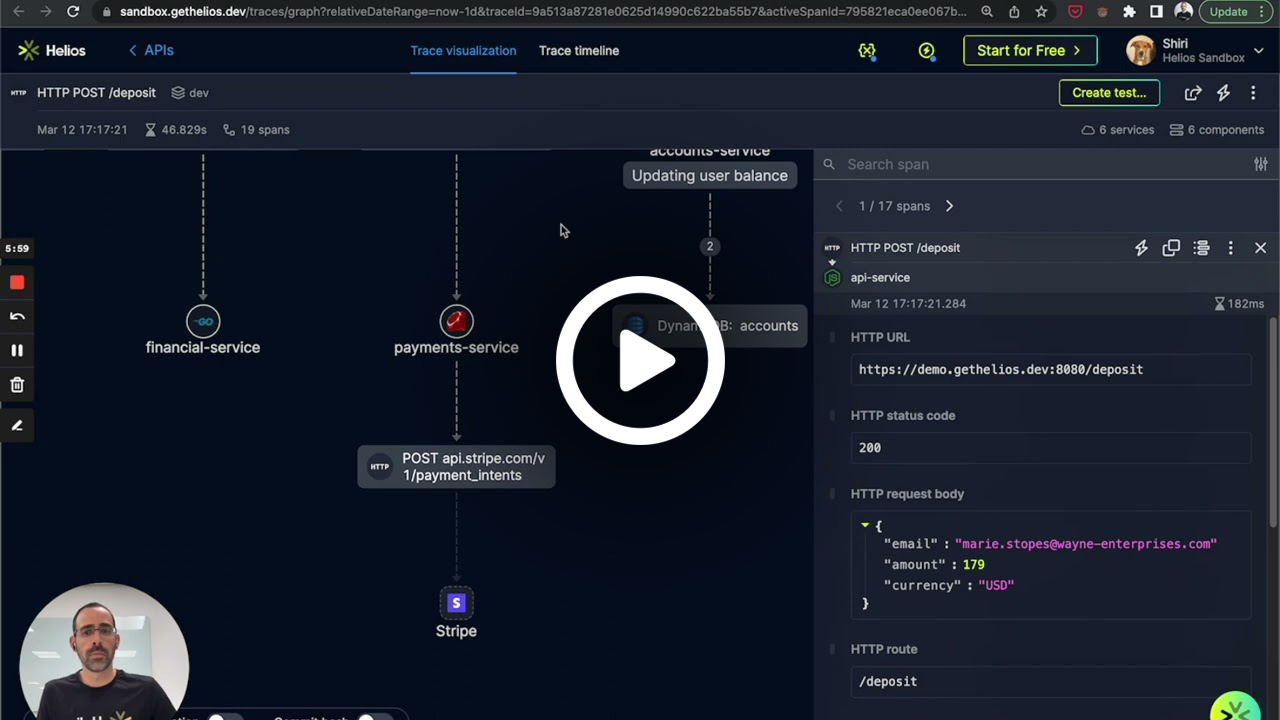
Recently I noticed an issue with this flow, where I was sometimes getting long response times from the application once uploading a file. To get a better understanding of where the application was spending so much time, I looked into recent sampled traces for this scenario:
Helios lists the recent spans sampled by the selected invoked API call. The “spikes” in the duration histogram at the top immediately showed what I was experiencing – some uploads were taking a significantly longer time to process by the application.
It was then time to look into more specific details.
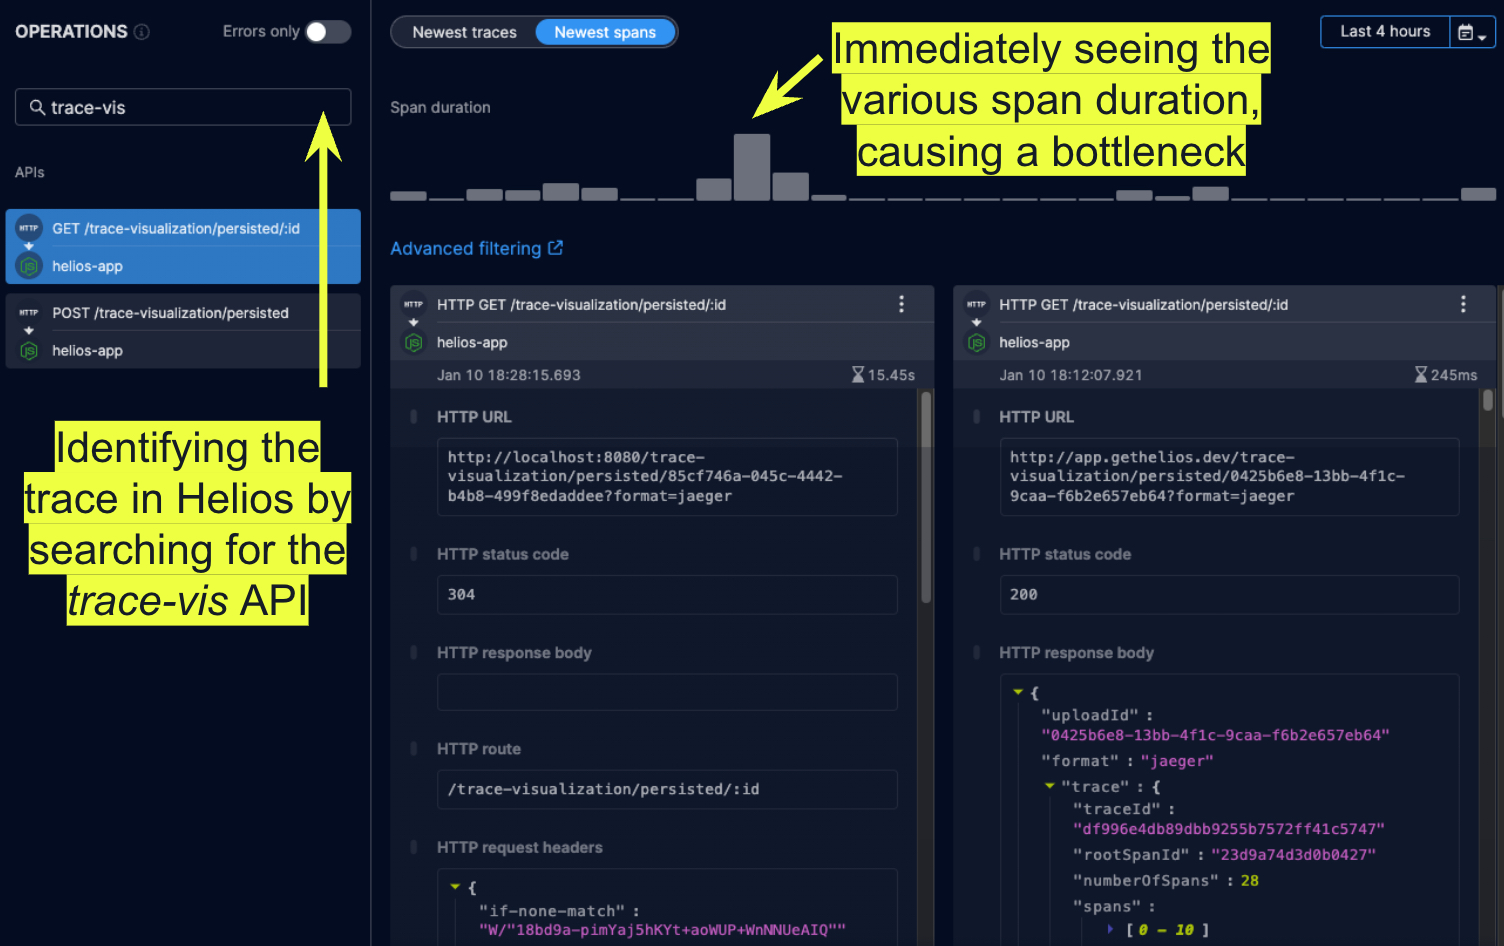
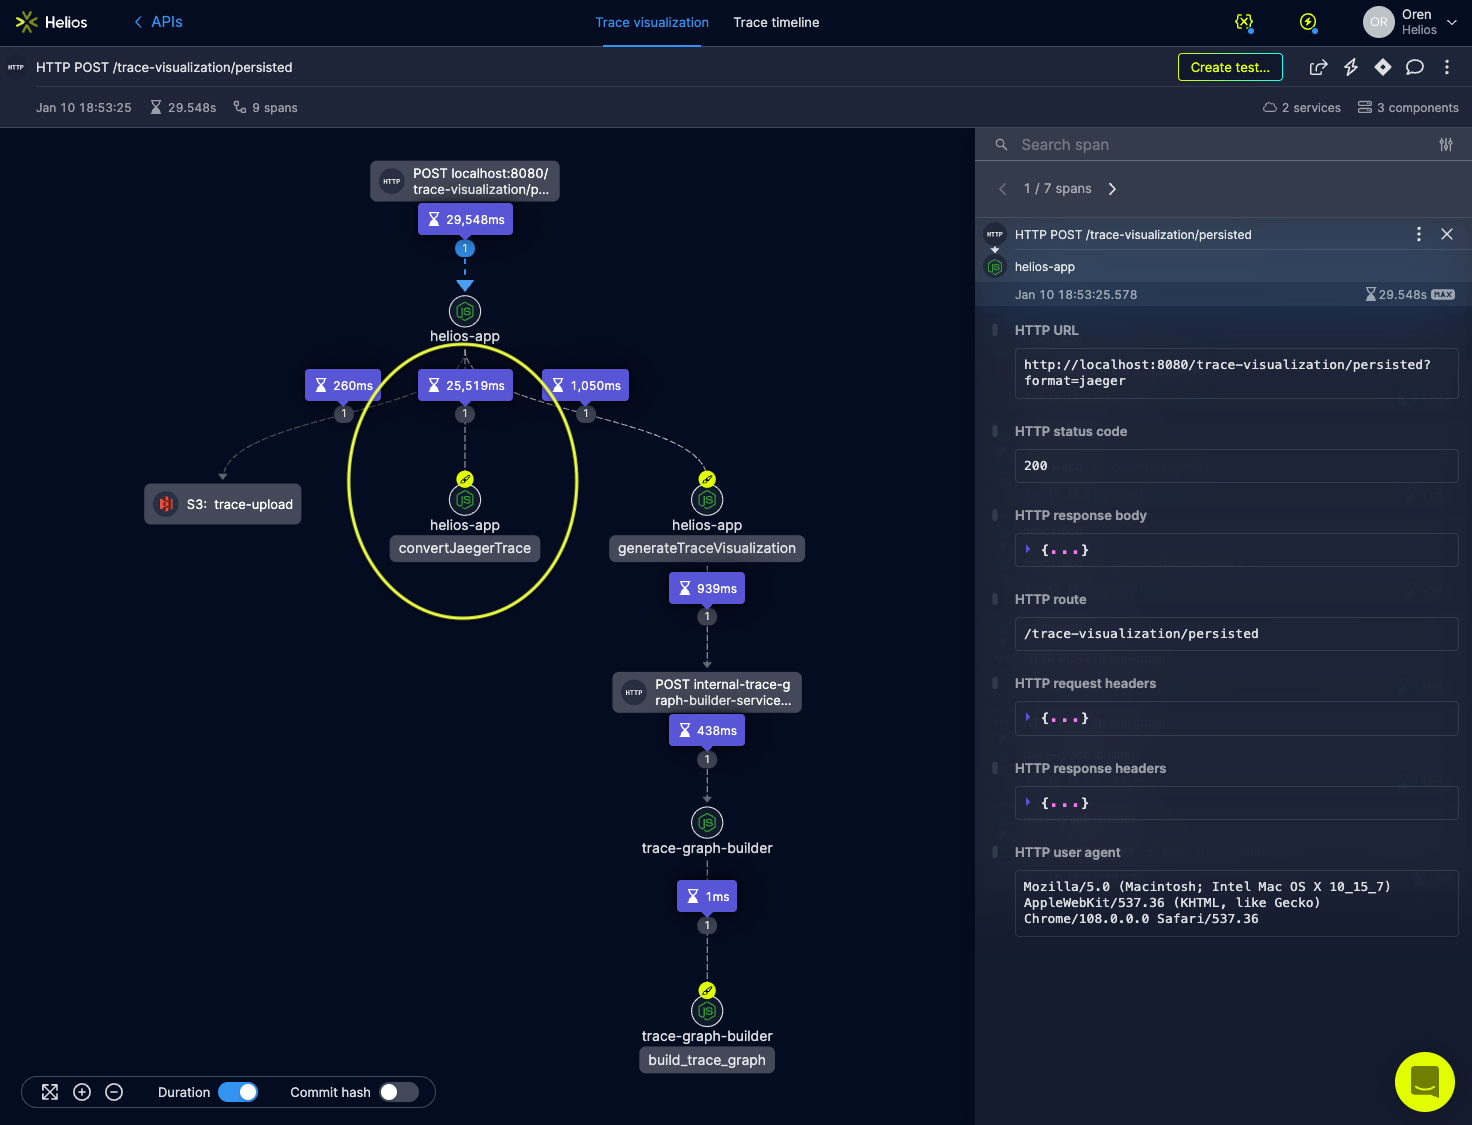
Clicking the tallest bar in the histogram revealed the following visualization for that trace:
 Trace #1: Identifying the bottleneck. E2E visualization of the trace-vis flow allows to immediately identify where the bottleneck – longest duration span – is.
By examining total trace and individual spans duration, I quickly got a clue into where the application was spending most of its time within this distributed flow. As you can clearly see, the majority of the time spent handling this upload was within the helios-app service, while the underlying graph-builder service, or the invoked S3 operation, came up with a response rather quickly.
This pointed me straight to the helios-app service code for further investigation.
2. Analyzing the bottleneck
After identifying the bottleneck in my trace-file upload it was now time to analyze the root cause of the bottleneck.
There can be many possible reasons for bottlenecks showing up in a system. To name a few:
- Resource utilization. Any resource, like CPU, memory or storage, is essentially limited. Different operations utilize different amounts of every resource, and once one or several of these resources is overutilized, bottlenecks occur.
- Network congestion. I/O operations are part of every distributed application, and the network has its own bandwidth limitations, which can often slow down the performance of the system.
- Synchronization. Complex systems need to synchronize their actions on shared datasets or other resources, which can inevitably lead to bottlenecks in the system.
- Unbalanced scaling. Different parts of a distributed application are usually scaled independently, which can lead to unbalanced performance in different parts of the same application, in time leading to bottlenecks.
In my case, it was clear that no I/O operation was the root cause for slowing down the application, since the problematic part of my trace was all within the helios-app service, as shown above. I also happen to know that this particular scenario is stateless, and hence doesn’t involve any shared resource synchronization. This led me to believe that this is probably a CPU or memory bottleneck I’m dealing with here. In many scenarios, and definitely when we’re dealing with highly distributed systems – this is already a huge step forward.
To figure out exactly where within the helios-app service the system was spending so much time, though, I decided to add in some custom spans.
Custom spans, a standard OTel mechanism for manual instrumentation, let you wrap any part of your code as a standalone span, which allows breaking up the trace into smaller pieces, and the ability to gain higher visibility into it. I decided to add a couple of custom spans in my code in the helios-app service, breaking-down the logic into smaller pieces.
After reproducing the issue, I came up with the following new trace:
 Trace #2: Analyzing the bottleneck. Leveraging manual instrumentation to isolate the pieces of the operation causing the bottleneck.
By using a custom span (convertJaegerTrace) to wrap an isolated part of my code, it became immediately apparent what really is the most time-consuming operation in the trace. Soon after, further inspection within that logic led me to a place where I detected a bug, causing severe load on CPU.
3. Implementing a solution
Once I identified the root cause of my bottleneck fixing it was straight-forward. Here’s another trace showing a handled request right after I addressed the bottleneck – you can clearly see the convertJaegerTrace custom-span’s duration has significantly shrinked compared to the previous trace.
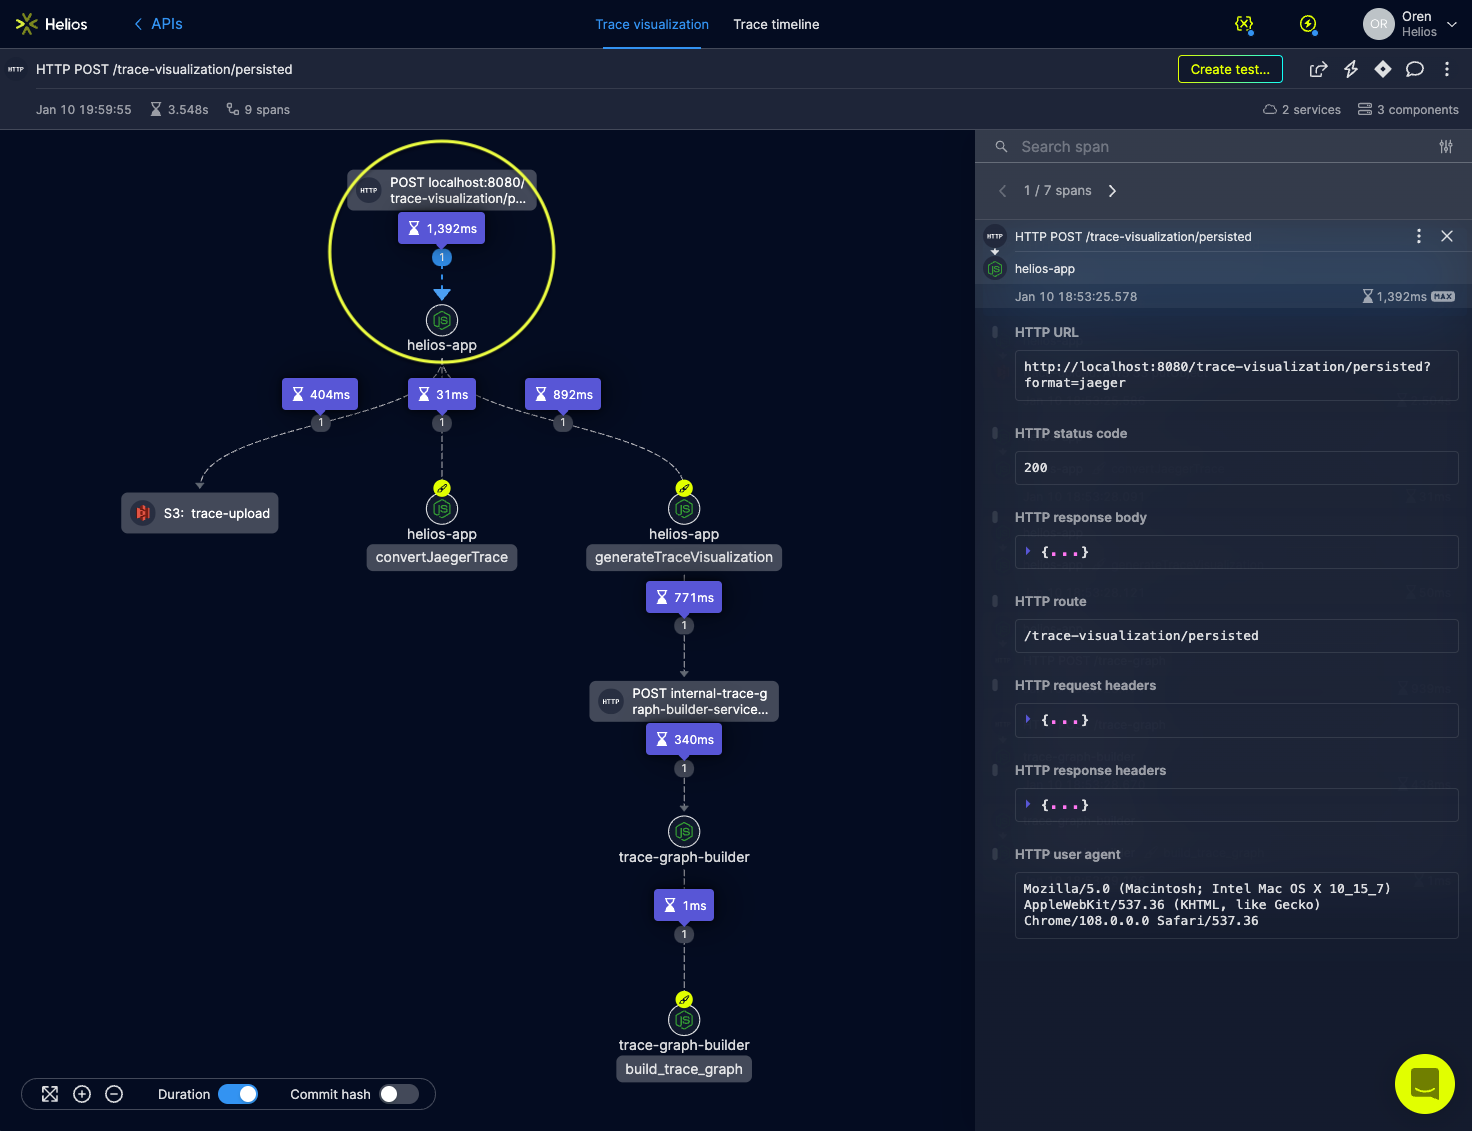 Trace #3: Implementing a solution. Confirming the bottleneck has indeed resolved and the E2E flow is a lot shorter on the trace visualization graph.
Of course, not all bottlenecks are created equal, and some may require introducing significant changes to the system in order to solve them. While tracing in general and in Helios in particular is great at helping you to find such issues, you will eventually have to solve them yourself. However, the ability to make changes and quickly get visibility into their impact by looking into new traces is very powerful. There is so much data available on every span and in every trace that can prove beneficial as you work to find a solution.
By using distributed tracing solutions like OpenTelemetry and Helios in my day-to-day work I can get visibility into bottlenecks in my application, solve them fast, and make sure they do not reappear over time.


