

How one visualization in Helios led to a discussion that got everyone on the same page
One of our core values at Helios is to eat our own dog food (or for those of you who want to keep it classy, “drink our own champagne”). While this is a known best practice among many product development teams, it’s even more important when working on tools meant to be used on an ongoing basis by developers. At Helios, we developers use our own tool for the visualization of different microservices and their interactions, to debug and troubleshoot specific flows while working on sprint tasks, and of course, to generate end-to-end tests. Using Helios to generate integration tests on main product flows is often included as part of our definition of done (DoD) in a sprint task.
This practice of using our own product to develop our own product means we get to be very active and involved in shaping what the product does. It also means that we ourselves are users, constantly exploring the product and learning from each other to ensure we’re building a product that actually solves the pain of working on distributed applications. And while we are very intentional about dogfooding and continuous feedback, sometimes we spontaneously find new ways to use the product.
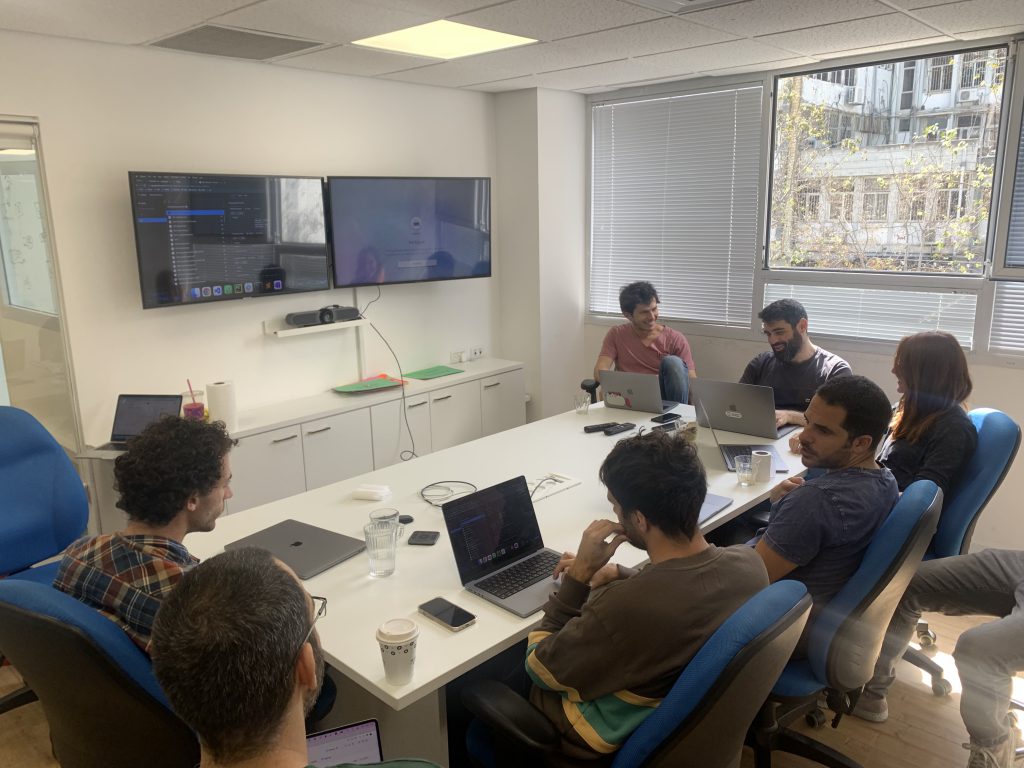
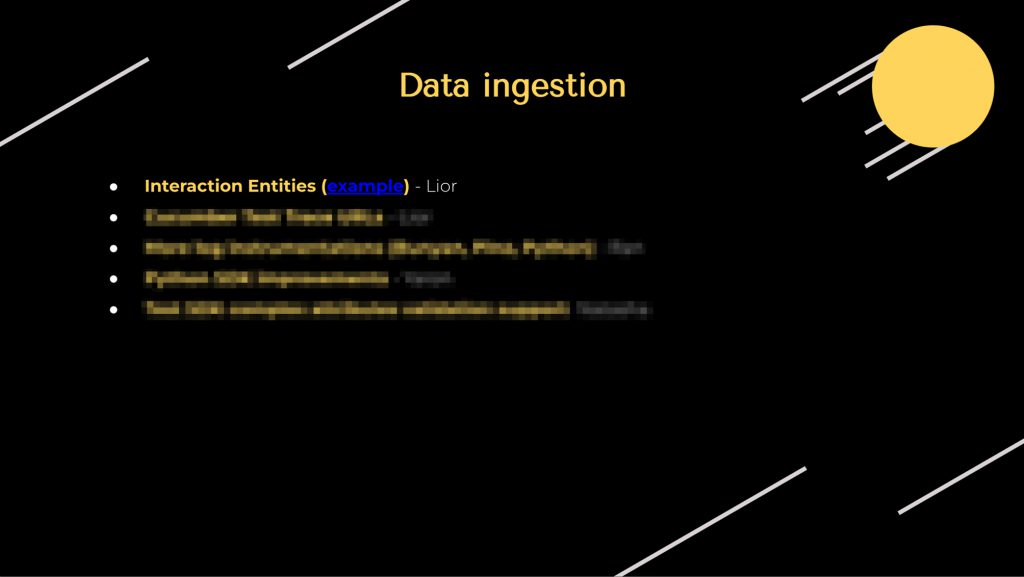
Case in point: Earlier this week, like every week, we held our sprint demo. When we got to the section about “data ingestion” – usually a time where we speak briefly on changes and improvements to the internal architecture – I began discussing the work I did on storing interactions. This means, in a nutshell, that from now on we’ll be storing interactions between services in a database. Until that point, interactions weren’t something we stored persistently, rather we relied solely on the original OpenTelemetry spans stored in Elasticsearch to infer interactions. Now that we can do that, we’ll be able to more easily run calculations, provide metrics, etc. because we won’t have to do it on the fly anymore. In the future, this will enable more functionality and better performance.
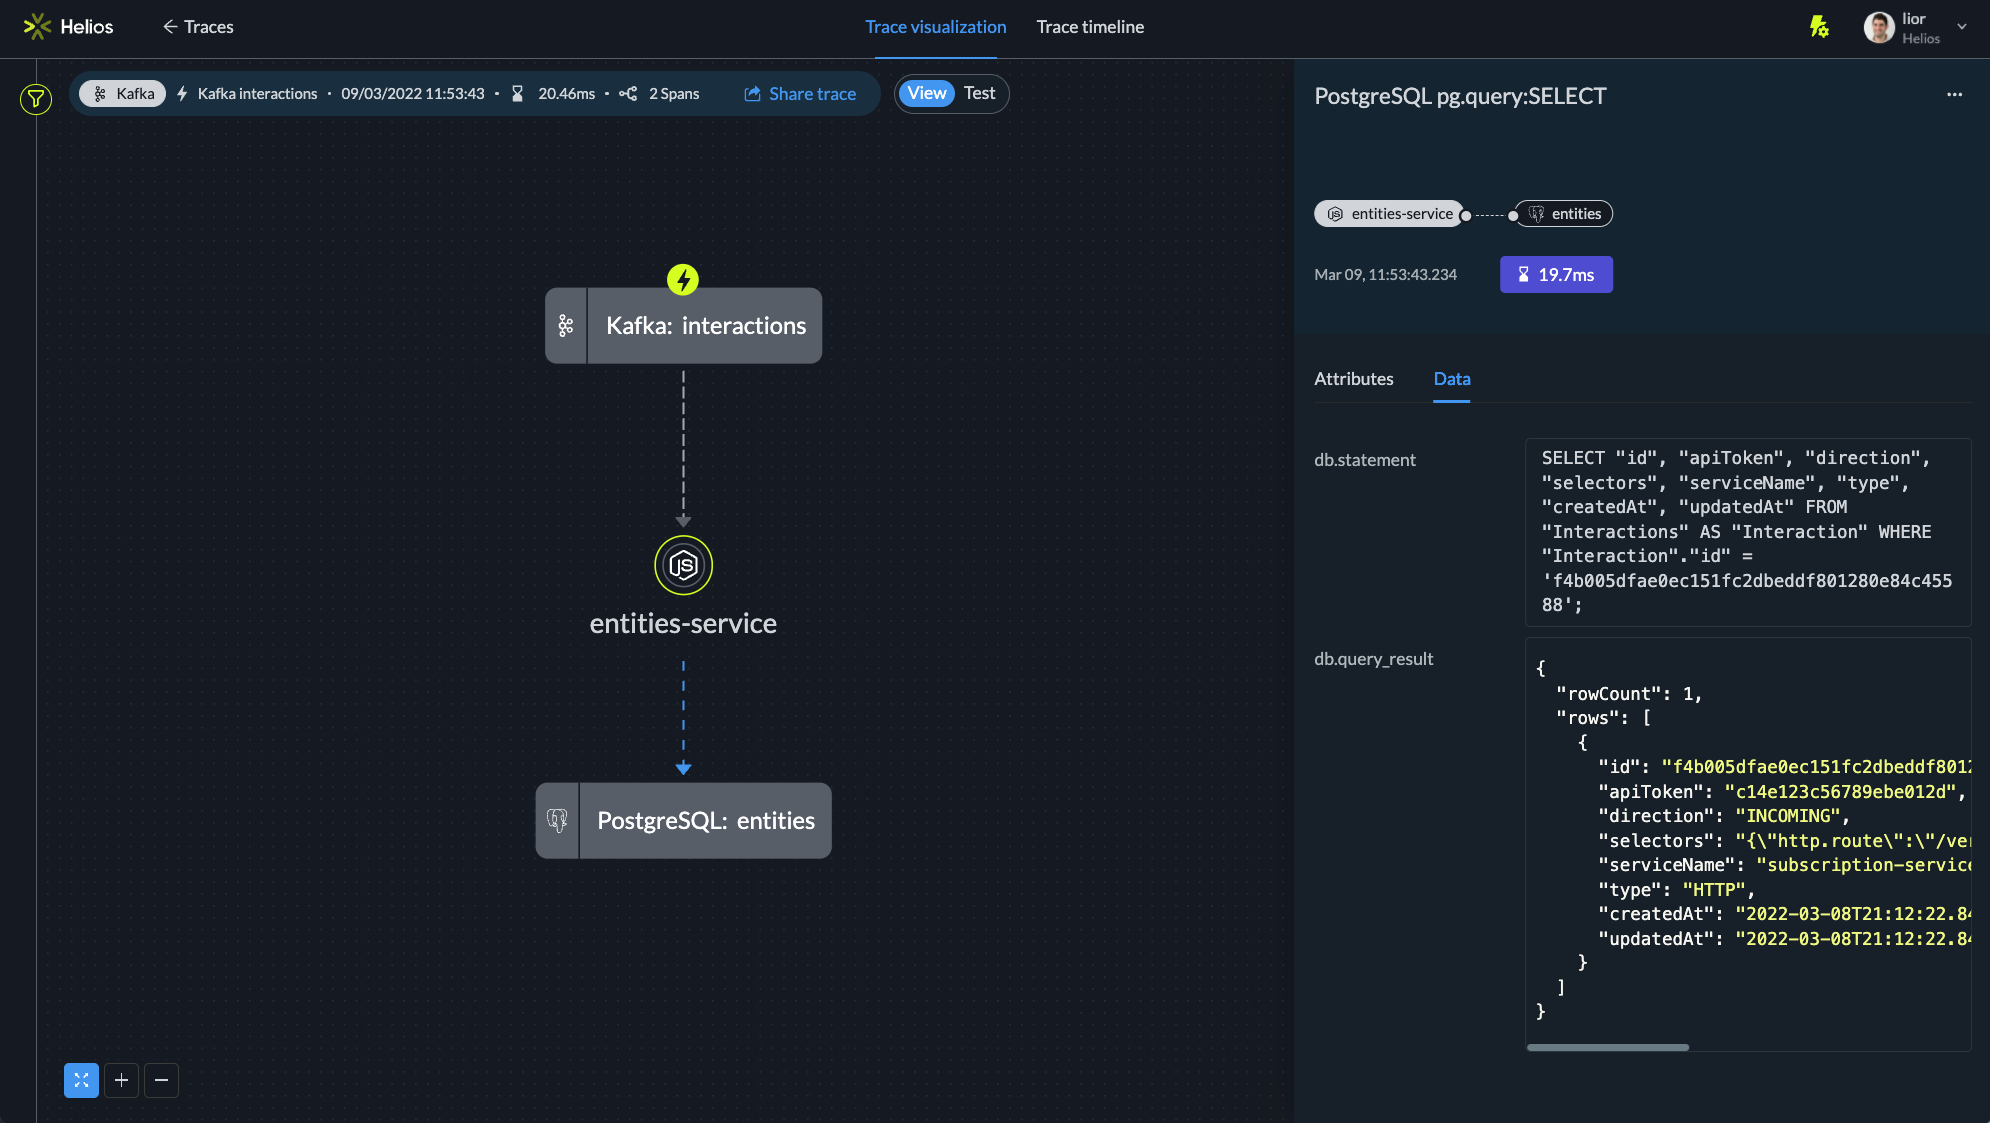
Instead of summarizing this work in a couple of plain, non-eloquent sentences like I’d normally do on a slide like the one below, I shared a link to a specific trace visualization I created in Helios.
I used the visualization to demo and explain to the team what this new interactions table is all about, in which service it can be found, what types of actions can be performed on it and why – all this directly from the visualization page. I preferred sharing the visualization because I thought it’d be the best and most interesting way to demonstrate the new feature.
And indeed, I got good responses from my teammates: using the product was a great way to intuitively understand the new feature and get all of us on the same page. Rather than summing up an internal improvement and just moving on to the next thing, sharing the visualization led to a deep, engaging discussion with the entire team. It also made me realize that Helios can be a great platform in use cases such as design reviews and onboarding where we need to explain what is happening in our system to new hires or audiences in a way they can easily understand.
Most importantly though, we all got excited that we used the product to show something new in the product. We witnessed in real-time we built something that adds value in organic ways, in ways that cannot be pre-staged during any design or discovery process, in ways that improve the day-to-day life of developers. It was a real win to see how we ourselves gained value from this usage. This is what excites me so much about our journey and being part of the team here at Helios – and it’s only the beginning!
Related – Debugging microservices in production
Learn more about trace visualization with Helios here.


