What is Distributed Tracing?
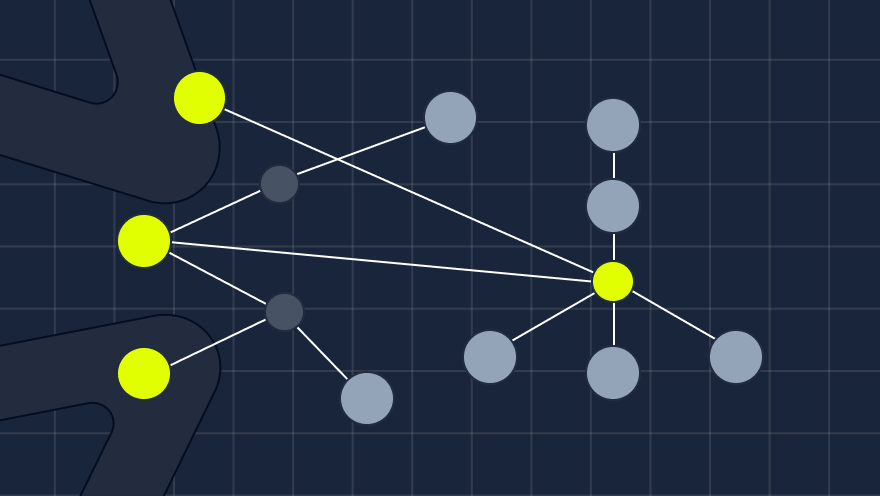
Distributed tracing is a method of monitoring request paths across distributed environments using unique identifiers. It tracks interactions with microservices, containers, and infrastructure, offering valuable performance insights. It allows developers to identify performance bottlenecks, troubleshoot issues, and optimize the system.
In a distributed system, a single request often triggers a chain of interactions between various components or microservices. Each component may have its own logs or monitoring data, but it can be challenging to correlate them and gain a holistic view of the request’s journey. Distributed tracing addresses this problem by generating and collecting trace data throughout the request’s lifecycle.
How does distributed tracing work?
Instrumentation
First, developers must add code to their applications or services to generate trace data. This involves adding unique identifiers like trace ID and span ID to each request and propagating them across different components and services.
A trace refers to a complete end-to-end path of a request or transaction as it flows through a distributed system. It represents the journey of a specific operation as it traverses various components and services in a distributed architecture.
A span represents a single operation or unit of work within a distributed system. It captures the timing and metadata associated with a specific operation and provides a way to track and understand the behavior of individual components and services.
 Image courtesy : Span and Trace Identifiers
Trace Generation and Propagation
Next, when a request enters an application component, it creates a span, an individual unit of work representing a portion of the request’s lifecycle. Each span contains information such as the operation name, start and end timestamps, and any relevant metadata.
And, since we’re working in a distributed application, these services will often communicate with other services and will propagate the span across the system as the request flows through the system.
The trace context (trace ID and span ID) is propagated across service boundaries, usually via HTTP headers or message headers in message queue systems. In distributed tracing, context propagation is crucial for connecting and correlating spans to construct a complete trace of a request or transaction as it flows through various services.
Trace Collection
Next, a central component, known as the trace collector or trace aggregator, receives the trace data from different components.
It assembles the spans related to the same request into a complete trace. These are collected data in a distributed datastore such as Elasticsearch or Cassandra.
Some popular available tracing data collectors are:
Trace Visualization and Analysis
The collected traces can be visualized in a distributed tracing tool, which provides a timeline view of the request’s path through various services. This allows users to see the duration and dependencies of each span, detect bottlenecks, and understand the overall system behavior.
One tool that can be used to visualize traces is Helios. As shown below, it lets you view all traces for a specific entry point while helping developers monitor and troubleshoot issues before it escalates.

Additionally, developers can further inspect each request and look into errors, payloads, and logs and gain an understanding of how the data flows in the system, as shown below.

Additionally, developers can inspect performance bottlenecks by taking a look into the span duration of each request, as shown below.

Wrapping up
Distributed tracing is a key method in helping organizations gain deeper insights into the behavior and performance of complex distributed applications. It offers several benefits, such as:
- Identifying erroneous components.
- Identifying latency issues
- Understanding dependencies between services
- Improve system performance.
- Better visibility into a microservices architecture.
As organizations continue to embrace microservices architecture and distributed systems, the adoption of distributed tracing will only grow. Leveraging distributed tracing tools and its best practices enables companies to deliver better user experiences, make data-driven decisions, and maintain a competitive edge in the fast-paced world of technology.


