


Serverless, as you may already know, is a cloud computing model where the cloud provider dynamically manages and allocates resources to execute code without the need for server provisioning or infrastructure management on the developer. This article overviews serverless observability, monitoring, and debugging, based on distributed tracing and OpenTelemetry (OTel).
It is gaining popularity as it allows developers to write and deploy code without worrying about the underlying infrastructure, while busting velocity, affordability (due to the cost savings from not having to provision and manage servers), expandability (as demand grows), and more. The most popular framework for building serverless apps is served today by Amazon Web Services (AWS) – Lambda
Like any other emerging technology, serverless computing also includes some various challenges, such as:
- Cold starts: When a serverless function is first invoked, it takes time for the underlying infrastructure to spin up. This can lead to latency issues, especially for applications that require a high degree of responsiveness. In other words, Lambda must initialize a new container to execute the code and that initialization takes time
- Debugging: Debugging serverless applications can be challenging due to the event-driven nature of the platform. This is because it can be difficult to track the flow of execution through an application that is made up of multiple functions that are invoked in response to events.
- Visibility: Serverless providers typically provide limited visibility into the underlying infrastructure. This can make it difficult to troubleshoot performance issues and identify security vulnerabilities.
To conclude, if you develop serverless apps, you know that observability, monitoring, and debugging are particularly challenging. However, there are proven best practices that change the picture and assist developers to gain back control over their apps and avoid distributed apps troubleshooting frustration.
Serverless Observability, Monitoring, and Debugging – A first look
Observability, as an added layer on top of monitoring, is a critical aspect of any application’s life cycle, providing valuable insights into its events-based behavior. As mentioned, achieving observability becomes more challenging in a serverless environment.
Typically, in a serverless architecture, AWS Lambda functions to interact with various cloud-native services such as queues, event streams, other Lambdas, and different types of storage. Each of these components generates its own set of logs, resulting in a scattered data landscape that makes correlating information and diagnosing issues a nearly impossible task.
This complexity is further compounded when it comes to serverless debugging. Unlike traditional environments (monolith apps), serverless applications are distributed and comprised of multiple functions. Consequently, it becomes challenging to pinpoint a specific event that triggered a problem, reproduce it, and identify the root cause of issues.
To effectively debug serverless applications, developers must have a clear visualization of the complete lifecycle of each transaction, including the multiple services that take part in it. Traditional monitoring tools, built on statistical, big data events, are not designed for such complexity.
For example, we can watch a predefined single metric for significant changes that indicate a problem — this is monitoring. But, observability includes useful data about its internal, contextual state, which is crucial for determining the root cause.
In other words, something else is needed on top of logging and metrics.
Distributed tracing comes onboard
This necessitates the implementation of distributed-tracing mechanisms that span multiple resources, including both AWS-native and external databases or APIs.
Distributed tracing works by recording the path that a request takes through the system, including the time spent at each step and additional contextual, granular data. This information can then be used to identify bottlenecks and other performance problems.
Distributed tracing is often used in conjunction with other tools, such as metrics and logging, to provide a complete picture of the health and performance of a distributed system. It leans on instrumentation that is enabled by OSs such as OpenTelemetry
In this regard, leveraging automated tools for instrumentation and distributed tracing (rather than manual instrumentation) proves to be highly beneficial. Such tools provide a comprehensive view of the system and significantly reduce the time and effort required for manual tracing, allowing for more efficient debugging and issue resolution.
Serverless Observability Challenges- A deeper look
What makes microservices apps in general and serverless in specific so challenging?
Resource limitations:
Serverless environments often have limitations on the amount of computing resources available to functions. Aggregating data in real-time or near real-time while considering these resource constraints can be demanding. Balancing the need for timely aggregation with the available resources becomes important.
Transient function instances:
Serverless functions are ephemeral and short-lived. They are created and destroyed dynamically based on the workload. This dynamic nature poses challenges for aggregating data, as traditional aggregation techniques relying on persistent processes or agents may not be applicable.
Incomplete data:
Monitoring data gathered from a single operation may not provide sufficient insight into the event within the overall serverless structure, making it difficult to pinpoint errors.
Telemetry data collection:
There are 3 forms of telemetry data – logs, metrics and traces
Logs: AWS Lambda functions generate logs that contain information about their execution, including any errors that occurred. (AWS Lambda observability provides developers with deep insights into the behavior and performance of their functions. Moreover, it allows them to troubleshoot issues quickly and easily.)
Metrics: AWS Lambda functions generate metrics that track the health of a function, such as the number of invocations, the duration of the function, and the number of errors. These metrics are crucial for AWS Lambda observability. They help developers monitor and troubleshoot the performance of their serverless applications.
Tracing – the missing element
As mentioned, logs and metrics are hardly enough for troubleshooting distributed environments, due to the complexity of microservices. Tracing data and trace-based analysis are needed.
Why is distributed tracing in serverless key?
Distributed tracing allows tracking the path of requests and identifying latency or error-causing bottlenecks. In microservices, the path is key to route cause analysis. OpenTelemetry (OTel), a widely adopted open-source framework, enables the collection and export of tracing data across different platforms and languages.
Tracing provides a detailed view of request journeys, revealing services, latency points, and errors. Popular tools like Jaeger, Zipkin, and AWS X-Ray aid in data collection and analysis, supporting serverless environments, however, they are missing on important capabilities.
OTel, as an open-source and vendor-neutral framework, seamlessly integrates with other 3rd party observability tools that turn the data into actionable for troubleshooting.
Instrumentation-based distributed tracing accurately captures comprehensive data, enabling tracing across systems and for instance, measuring end-to-end latency in cloud-native applications. But still, in order to complete the picture, there’s a need to visualize the data and add actionable error alerts with granular and contextual data.
To summarise this part, distributed tracing (on top of logs and metrics) tracks paths of requests, based on data instrumentation, that allows full visibility into the context of event-driven transactions. OpenTelemetry is today’s standard in collecting and exporting distributed tracing data, essential for troubleshooting. 3rd party tools are used to easily implement OTel, add automation capabilities, enrich the experience with trace-based visualization, and add granular error-related insights.
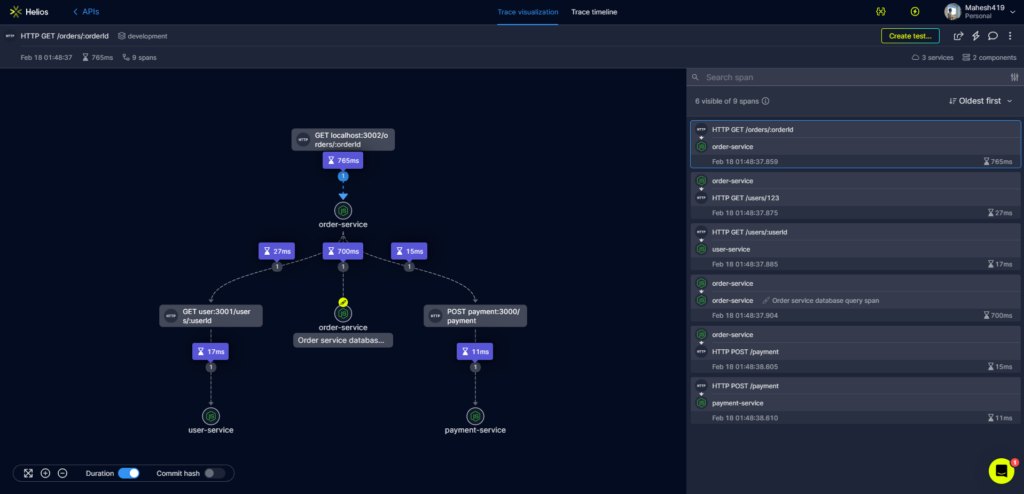
*Above an image of trace-based visualization with data related to the spans
What can you do with tracing for serverless?
Identifying and troubleshooting bottlenecks
By assigning unique identifiers to requests and monitoring their progression, distributed tracing enables the identification of bottlenecks and slowdowns. Unlike traditional metrics or logging solutions, distributed tracing provides a detailed view of application flows, allowing for precise identification of delays and bottlenecks. Click here for a few real-life examples of identifying bottlenecks with distributed tracing
Moreover, it proves especially beneficial in frontend development, serving as a powerful tool for debugging latency issues. By visualizing spans and leveraging technologies like OpenTelemetry and frontend instrumentation, developers can effectively analyze and resolve bottlenecks, resulting in accelerated development and reduced Mean Time to Resolution (MTTR).
Resolving communication issues between services
Distributed tracing helps developers make sense of sync and async flows and their dependencies. It ensures that services interact with each other – as part of the SDLC.
Benefits of implementing distributed tracing:
Organizations can gain several benefits by implementing distributed tracing in a serverless environment. Some of them are listed below.
- Minimizing MTTR: Distributed tracing can help organizations identify and resolve issues quickly, leading to a reduction in Mean Time to Resolution (MTTR).
- Better developer experience, Distributed tracing can improve the overall developer experience by providing them with a more efficient and reliable way to build and troubleshoot distributed applications.
- Cutting engineering costs: Distributed tracing reduces the amount of time and resources organizations spend on troubleshooting and debugging issues.
- Gaining back control: Distributed tracing can provide organizations with better visibility and control over their serverless environments, leading to more efficient and effective management.
- Increasing app quality: Distributed tracing improves the overall quality and performance of the applications by monitoring serverless applications and resolving issues promptly.
Being practical- Implementation challenges, data enrichment, and getting started
Implementing OpenTelemetry-based distributed tracing is challenging due to a few reasons, such as:
- Complexity: OpenTelemetry is a complex framework with a lot of features. This can make it difficult to understand and implement, especially for developers who are not observability experts.
- Data collection: OpenTelemetry can collect a lot of data through instrumentation. This can put a strain on your infrastructure and make it difficult to store and analyze the data.
- Data analysis: OpenTelemetry can generate a lot of data. This can make it difficult to analyze the data and identify performance bottlenecks or other issues to make the data actionable.
- It does not provide visualization or analysis
Still, if you wish to instrument AWS Lambda functions and send traces to a configured backend, by implementing OpenTelemetry on your own, visit this guide
E2E trace-based visualization and troubleshooting analysis for serverless environments:
As mentioned above, 3rd party tools help easily implement distributed tracing, based on OpenTelemetry and provide better insights into microservices-based systems. Helios is one such tool that can help you implement OpenTelemetry and gain better visibility into your distributed applications.
For instance, Helios is an OTel-based tool that helps developers enjoy an easy installation of distributed tracing and also enriches the experience by visualizing traces (so developers can see how requests flow through their system in real-time), adding granular error data, error insights, and actionable troubleshooting alerts. It allows developers to identify any components or factors that are causing slowdown or stagnation with the help of its inter-communicating services.
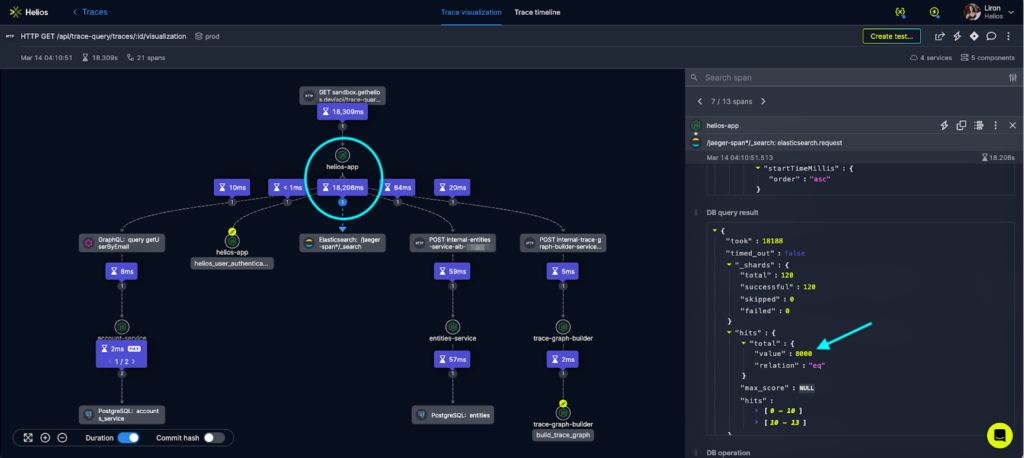
One main advantage of the tool is that it provides users with additional insights through data and visuals. For example, you can see the execution time of each span, the involved services, and any error codes returned. This amount of information is essential for comprehending the dynamics of your system and detecting issues rapidly.
The image below shows how analyzing bottlenecks in the E2E flow using trace visualization is done:
While not made only for serverless environments, but to cloud native apps in general, Helios simplifies the implementation and maintenance of serverless distributed tracing while providing additional data and visualization to help developers understand their systems and troubleshoot serverless apps efficiently.
Get started with Helios for AWS Lambda
Watch now: Lambda monitoring: Combining the three pillars of observability to reduce MTTR-
Conclusion
Serverless computing offers numerous advantages, including faster time-to-market for products and services, cost-effectiveness, and scalability. However, serverless observability, monitoring, and debugging can be challenging due to the complexity of correlating data across multiple components.
Collecting logs, metrics, and traces is essential to achieve complete observability.
Distributed tracing based on OpenTelemetry (OTel) is a key practice that enables engineers and operations teams to understand how requests propagate through their systems and identify issues that can cause latency or errors.
Trace-based observability solutions such as Helios offer E2E distributed tracing from installation to visualization and error data alerts.
Related: Debugging and troubleshooting microservices in production—All you need to know


