What is a Trace?
A trace refers to the end-to-end monitoring and tracking of a user request as it flows through multiple microservices. It is part of distributed tracing, a technique used to understand the flow of requests and responses across various microservices that collaborate to provide a complete service.
Tracing is one of the three pillars of observability that helps understand the lifetime of a request that flows through a distributed system.
In a microservices-based system, a single user request often triggers a series of interactions between multiple microservices. These interactions might involve various API calls and communication between different services. Tracing allows developers and operators to analyze the journey of a request and the time taken by each microservice to process the request.
The Architecture of a Trace
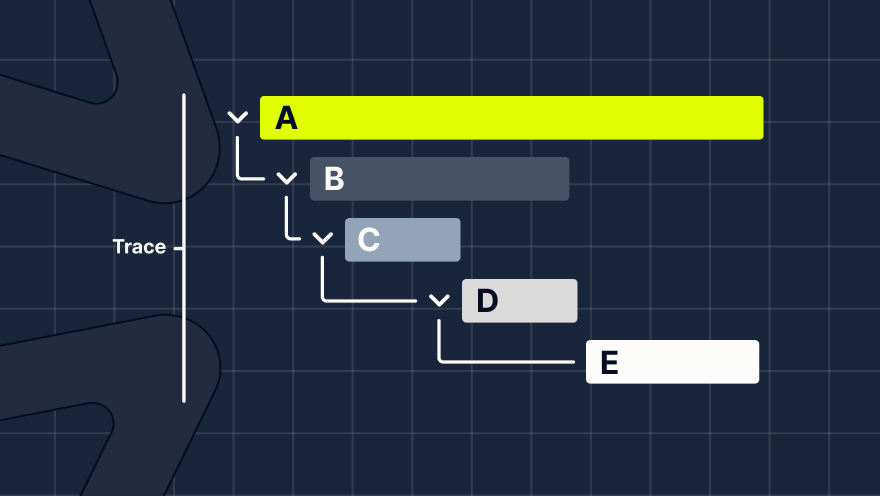
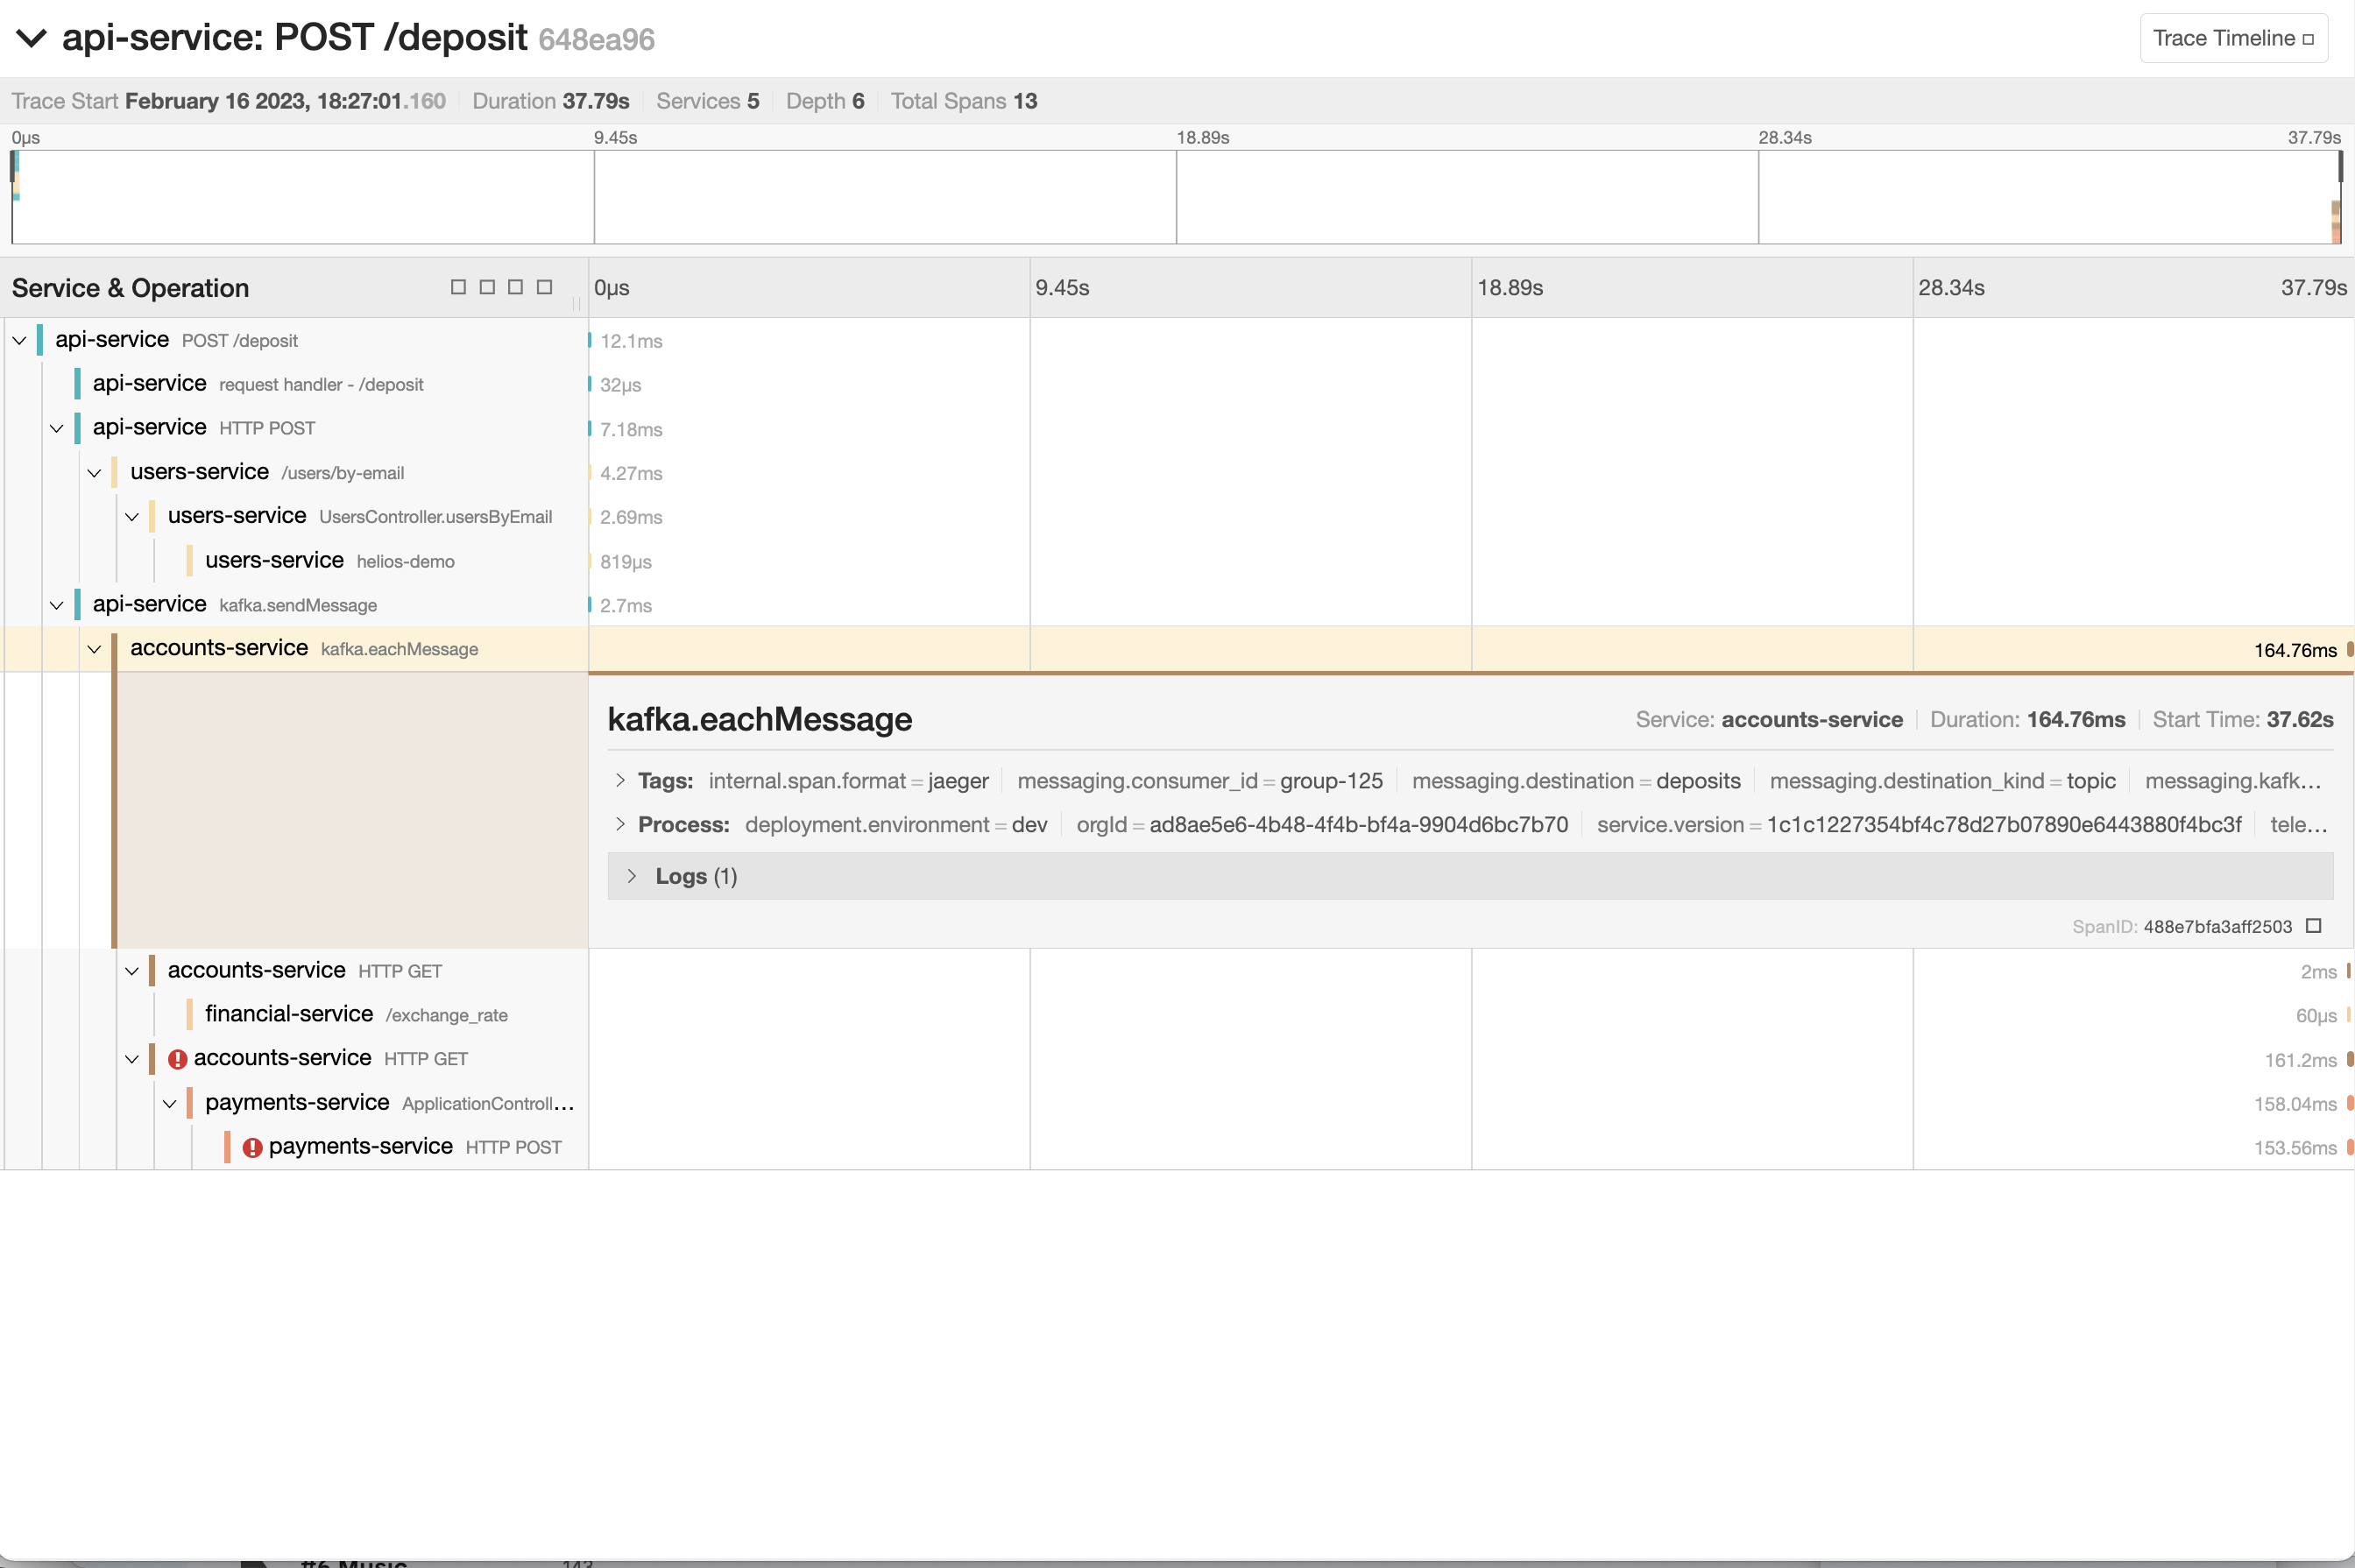
Traces are essential in tracking the full path your request takes through your application during its lifetime.
A trace is comprised of a span.
A span is a fundamental unit of tracing that stands for a piece of the workflow (a unit of work), for example, an HTTP request or a database query. A trace is a tree of these small spans.
Every trace has a globally unique identifier as its Trace ID. Each span within a specific trace has its own Span ID under the same Trace ID. In distributed tracing, spans correlate via a context and assemble a coherent trace through the mechanism of context propagation.
Traces vs. Logs
Unlike logs that provide discrete and individual records of events and messages within an application, traces offer a cohesive and connected view of the complete flow of a user request through a distributed system, allowing developers to comprehend the sequence of events, dependencies between microservices, and the time taken by each component to process the request.
Benefits of Tracing
Tracing allows for performance monitoring, helping identify bottlenecks and areas of high latency. Troubleshooting and debugging become more efficient as tracing aids in pinpointing the root cause of issues in microservices-based systems. Additionally, understanding service dependencies becomes easier, facilitating better management and optimization. Capacity planning and resource allocation benefit from insights into traffic patterns across microservices. Moreover, monitoring service-level agreements (SLAs) and service-level objectives (SLOs) becomes more effective with tracing. The ability to capture errors and exceptions during request processing improves incident response and system reliability. Tracing is valuable during development and testing stages, as it helps assess the impact of changes on the system.
Challenges of Tracing
- Trace data is frequently generated in substantial quantities, especially in large-scale applications, resulting in high costs of collection, storage, and transmission. To achieve a balance between observability and budget constraints, traces are typically sampled. Sampling involves making decisions on whether to process or export a span, thus controlling the amount of trace data collected and transmitted.
- Privacy and security issues can arise when working with traces. Traces may contain confidential information on users and interactions. Therefore, it is necessary to have proper mechanisms and regulations in place to manage sensitive information contained within traces, especially when working with third-party tracing tools.
Tracing tools
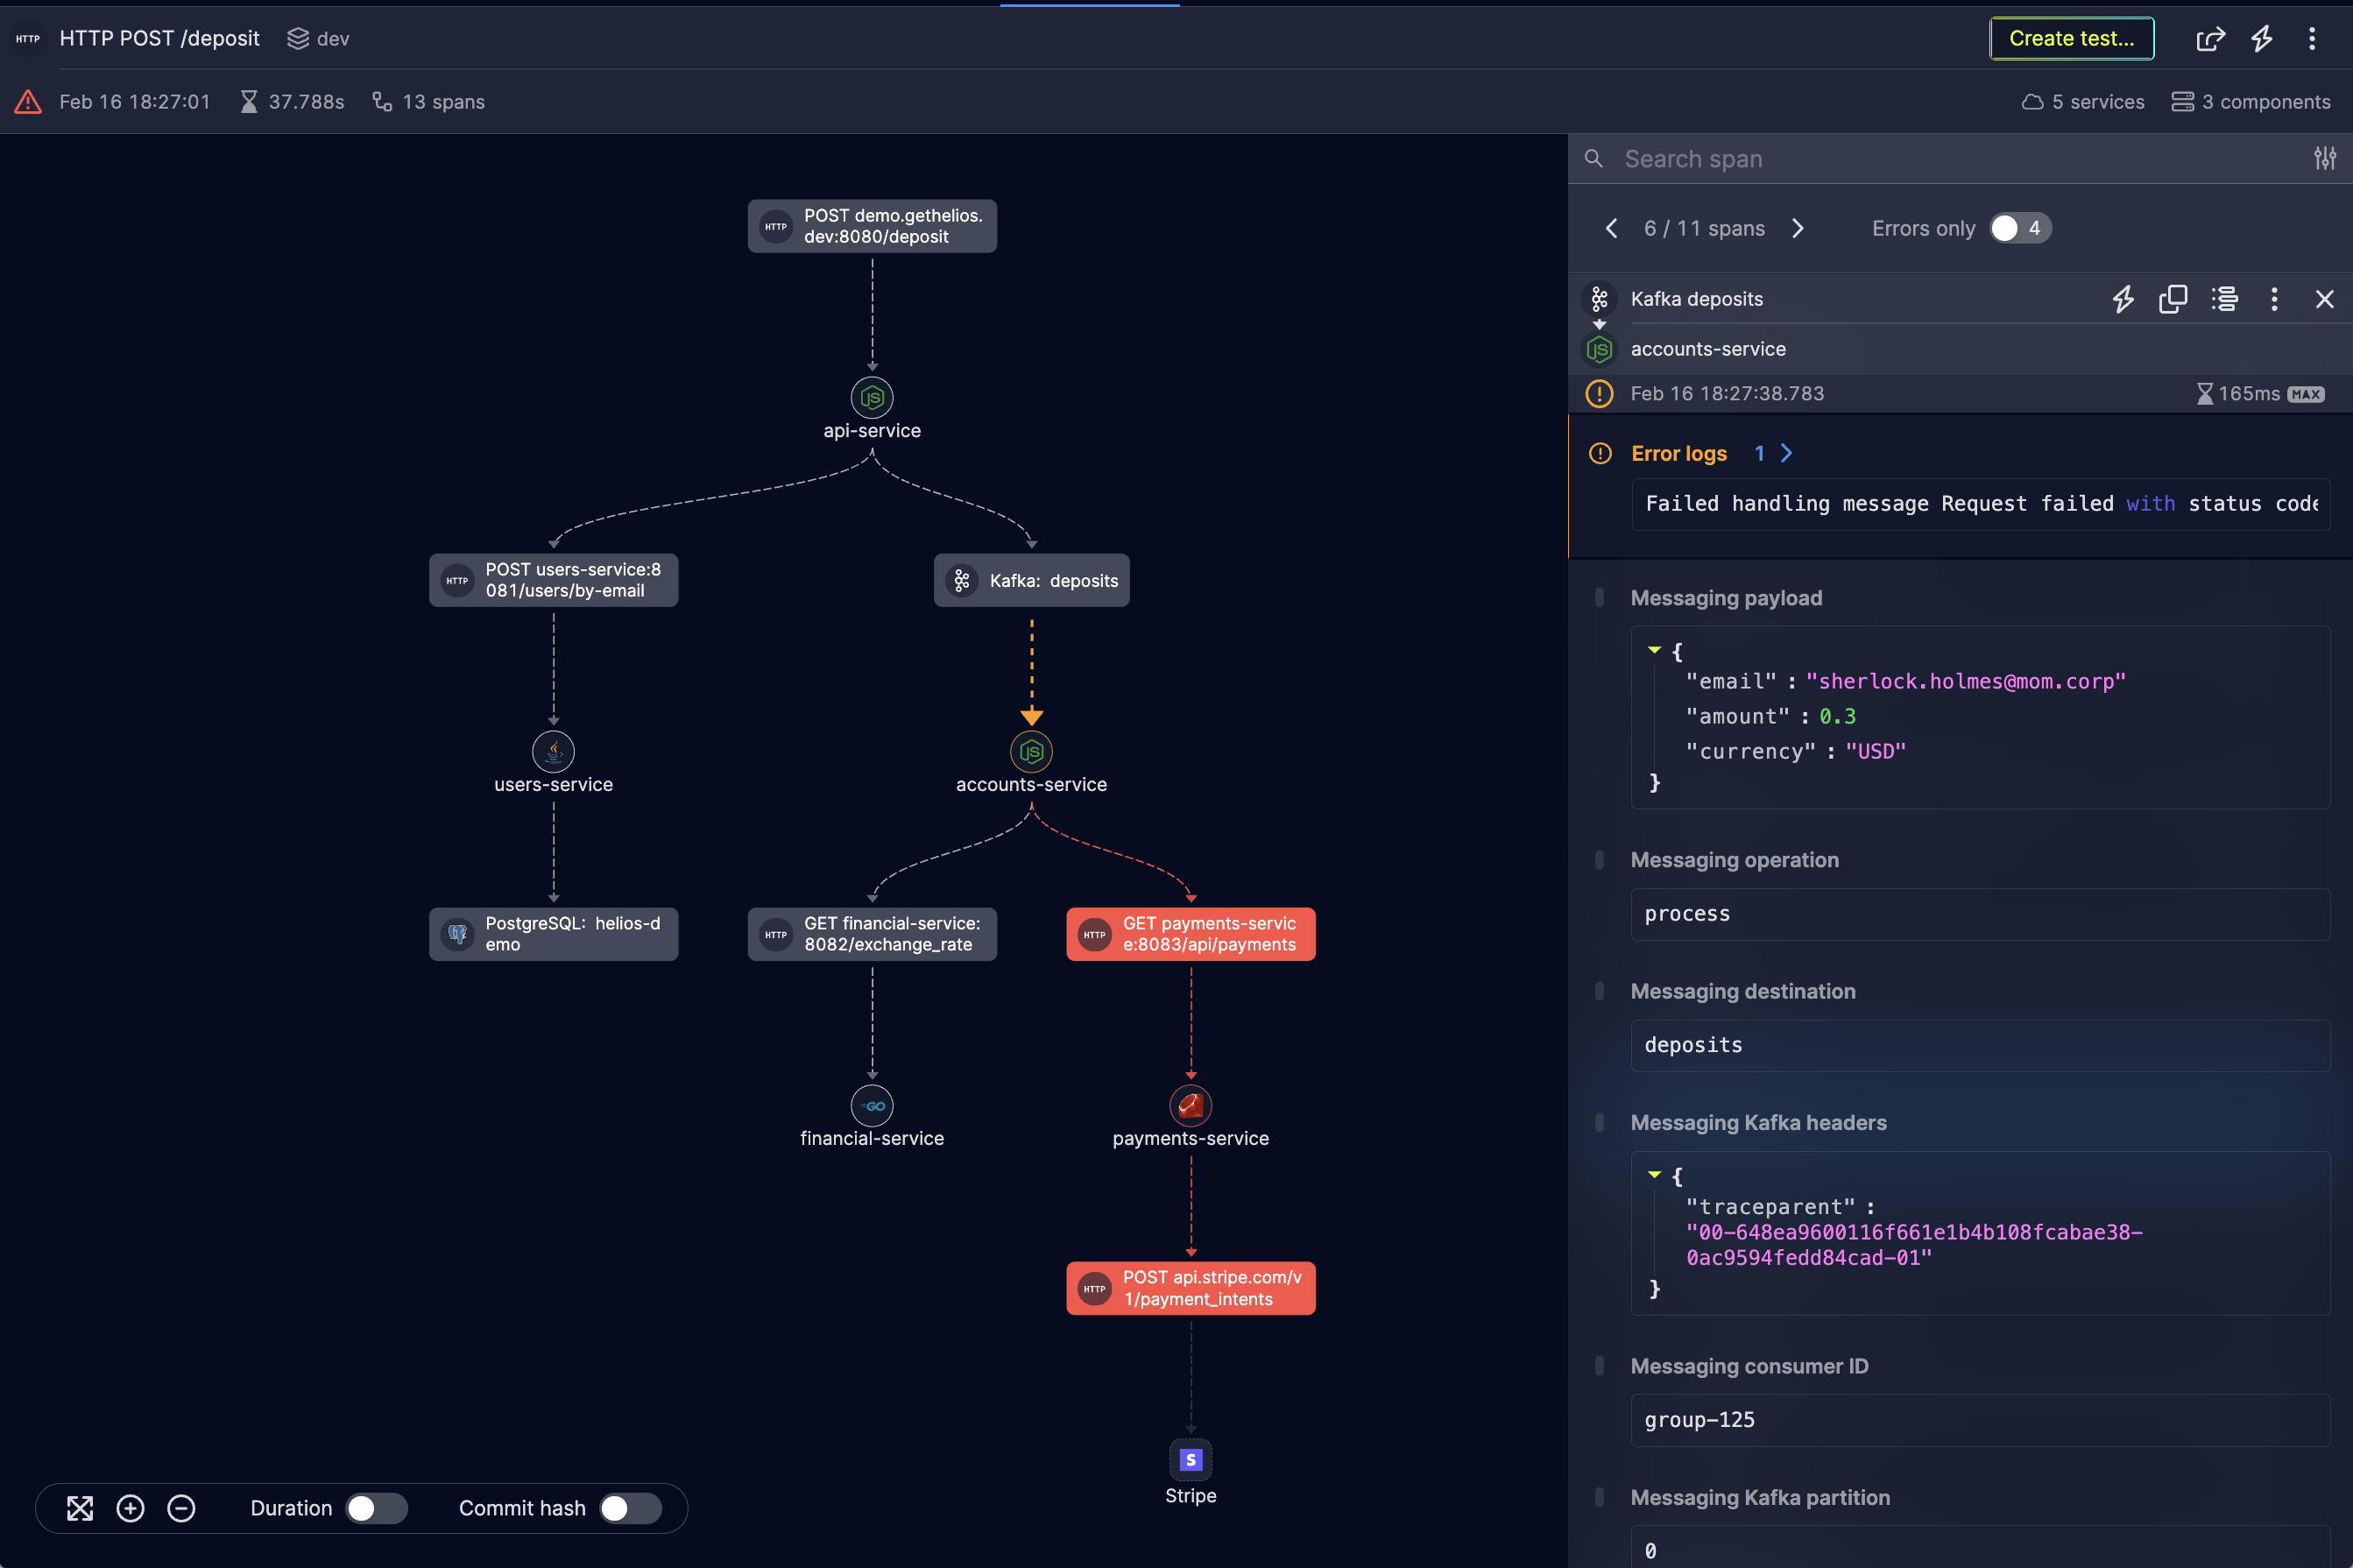
1. Helios – Helios is a fantastic observability platform allowing the Dev and Ops teams to troubleshoot faster with end-to-end application visibility using OpenTelemetry.
2. Lightstep – This full-context distributed tracing tool provides distributed tracing in a microservice or a multi-cloud environment with complete end-to-end system visibility.
3. SigNoz – SigNoz, which is open source, is an APM (Application Performance Monitoring) and observability tool that facilitates a unified user interface for presenting traces, logs, and metrics.
4. Jaeger – Jaeger is another open-source and widely-used tool that offers many features like distributed context propagation and service dependency analysis.
5. Zipkin – Initially developed by Twitter, Zipkin is also a great choice as a distributed tracing tool. But given its limited UI, developers may need to use a tool like Grafana for better visualization.
Tracing with Helios
Traces play a vital role in understanding the intricacies of modern software systems, particularly in microservices architectures. Helios simplifies the process of tracing user requests across microservices, providing a comprehensive view of system behavior. With Helios developers can gain deeper insights into their applications’ performance, ultimately leading to improved reliability and enhanced user experiences. Embracing distributed tracing tools like Helios is the key to unlocking the full potential of complex and distributed applications.