

Helios’ OpenTelemetry trace visualization tool provides visibility like never before into how data flows through your entire application, across any environment. Use it for free with any of your traces from Jaeger.
OpenTelemetry (OTel) and advanced distributed tracing solutions can be handy tools when you’re a developer facing what we call app flow blindness – or not being able to see your application flows and microservices components in a distributed cloud environment. In distributed environments, application flows are handled by various services and cloud entities which are generally siloed. Sometimes, you might not see the dependencies and impact an apparently-independent microservice has on other downstream parts of a flow. Our own engineers have spoken at length about this challenge and how distributed tracing is helping them save time and identify issues fast (for example, here and here).
Why does this matter? App flow blindness can stifle the developer experience, slowing down every step of the dev process, from writing the code, to testing it, to using it. In this blog post we’ll take you through the importance of observability and OpenTelemetry for understanding what’s happening in your app flows. We’ll also show you how easy it is to get visibility into your E2E flows when using Jaeger tracing.
We will cover the following topics:
- The power of distributed tracing
- Helios vs. Jaeger: Trace visualization
- Jaeger tracing visualization with Helios
- Using trace visualization to identify issues fast
- Why should developers care about observability?
- Why we embrace OpenTelemetry
The power of distributed tracing
For all those times you feel like you’re walking in the dark when navigating what goes on behind your app, distributed tracing tools offer a light switch in the form of advanced observability. Distributed tracing is a technique used to track the end-to-end behavior of a request as it travels through a microservice-based architecture. By tracing the request through multiple services and reporting on the time taken for each step of the request’s journey, distributed tracing also allows you to identify performance bottlenecks and improve the overall efficiency of a microservices-based system.
Distributed tracing solutions enable observability into how data flows in your application. Leveraging context propagation between different operations, the trace automatically aggregates data from the request flow, consolidates various transactions into one root action and attributes each transaction to one user’s request. Put simply, distributed tracing shows all the transactions that occurred from one trigger operation.
Some use cases of distributed tracing include:
- Monitoring the processing time of a request as it passes through multiple microservices in a microservice-based architecture
- Debugging issues in a microservice-based architecture by tracing the flow of a request through different services
- Identifying performance bottlenecks in a microservice-based system by measuring the time taken for each step of a request’s journey
- Analyzing the behavior of a system in real-time to identify and resolve issues quickly
Using OpenTelemetry, an open-source collection of tools, APIs, SDKs, and tools for creating and gathering telemetry data, distributed tracing helps developers to understand their microservices architecture and traces.
Helios vs. Jaeger: Trace visualization
In a previous blog post we discussed the similarities and differences between Helios and Jaeger. While Jaeger is a solid open source tool, the Helios distributed tracing solution adds on to it additional capabilities that give developers more information and actions for troubleshooting and testing. To help users of Jaeger tracing experience the power of the advanced trace visualization capabilities Helios offers, we also offer a free OpenTelemetry trace visualization tool that provides granular visibility and contextual insights into your complex sync and async workflows. In addition, the Helios distributed tracing platform helps you understand the dependencies between different components in your apps and enables you to detect changes across versions. These insights are key to troubleshooting your applications quickly and easily.
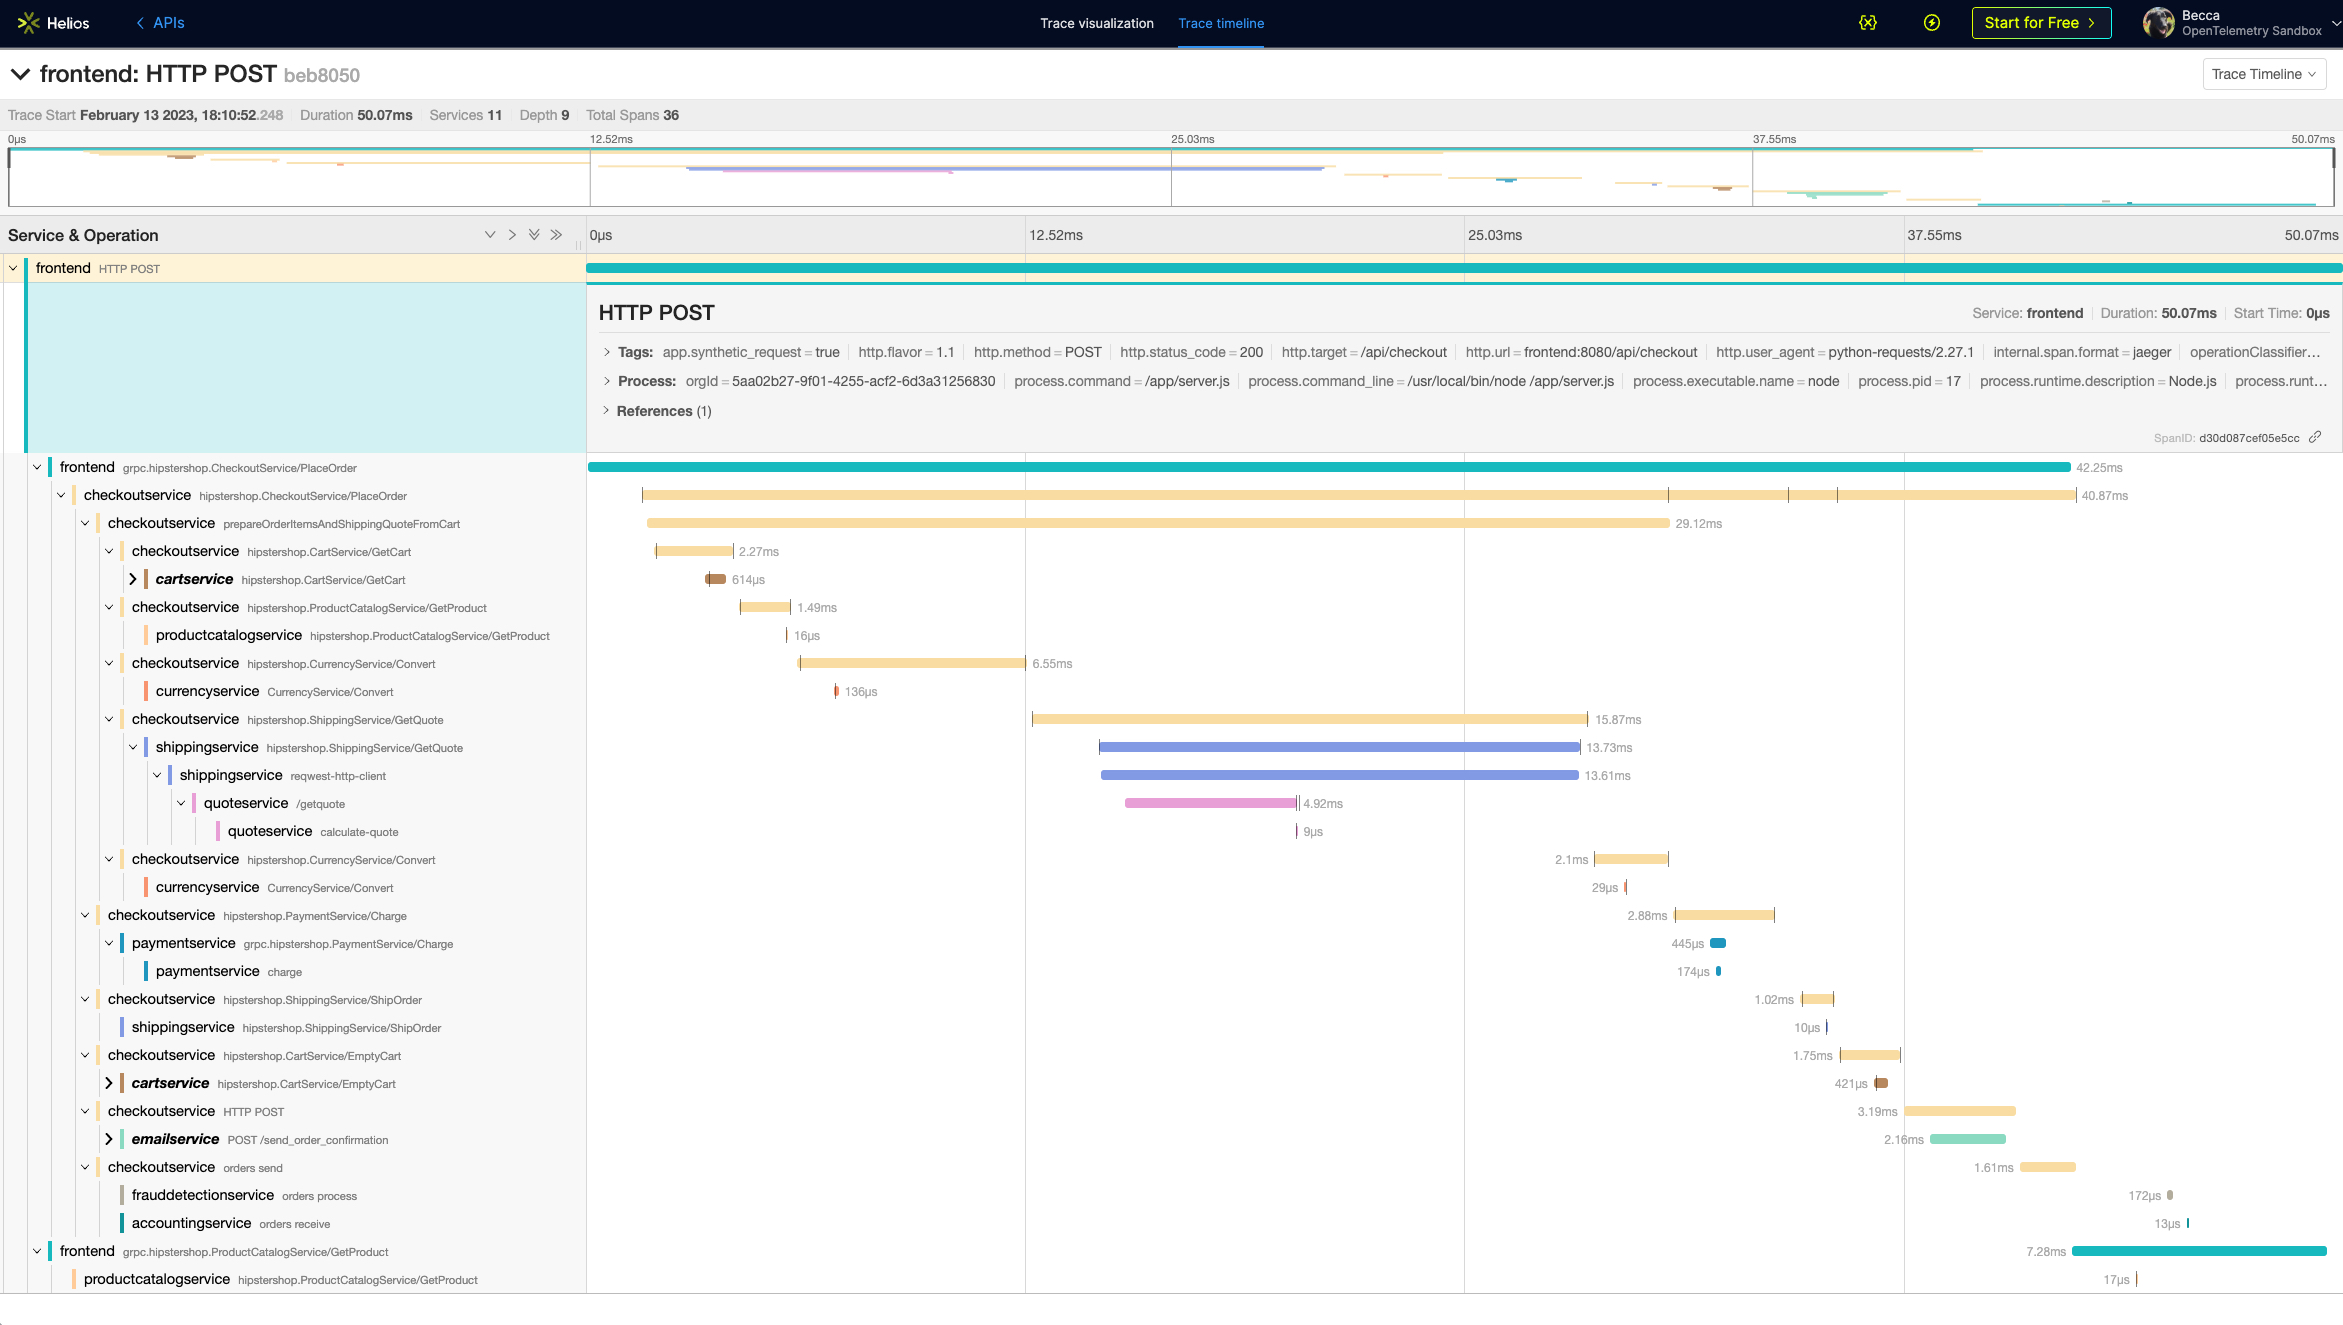
Take as an example this trace from the official OpenTelemetry Demo.
Jaeger provides a view of your traces, but it is limited to a timeline view that is difficult to read when you have large, complex traces:
When using Helios’ advanced trace visualization (as part of the distributed solution or in the OpenTelemetry trace visualization tool), it will look like this:
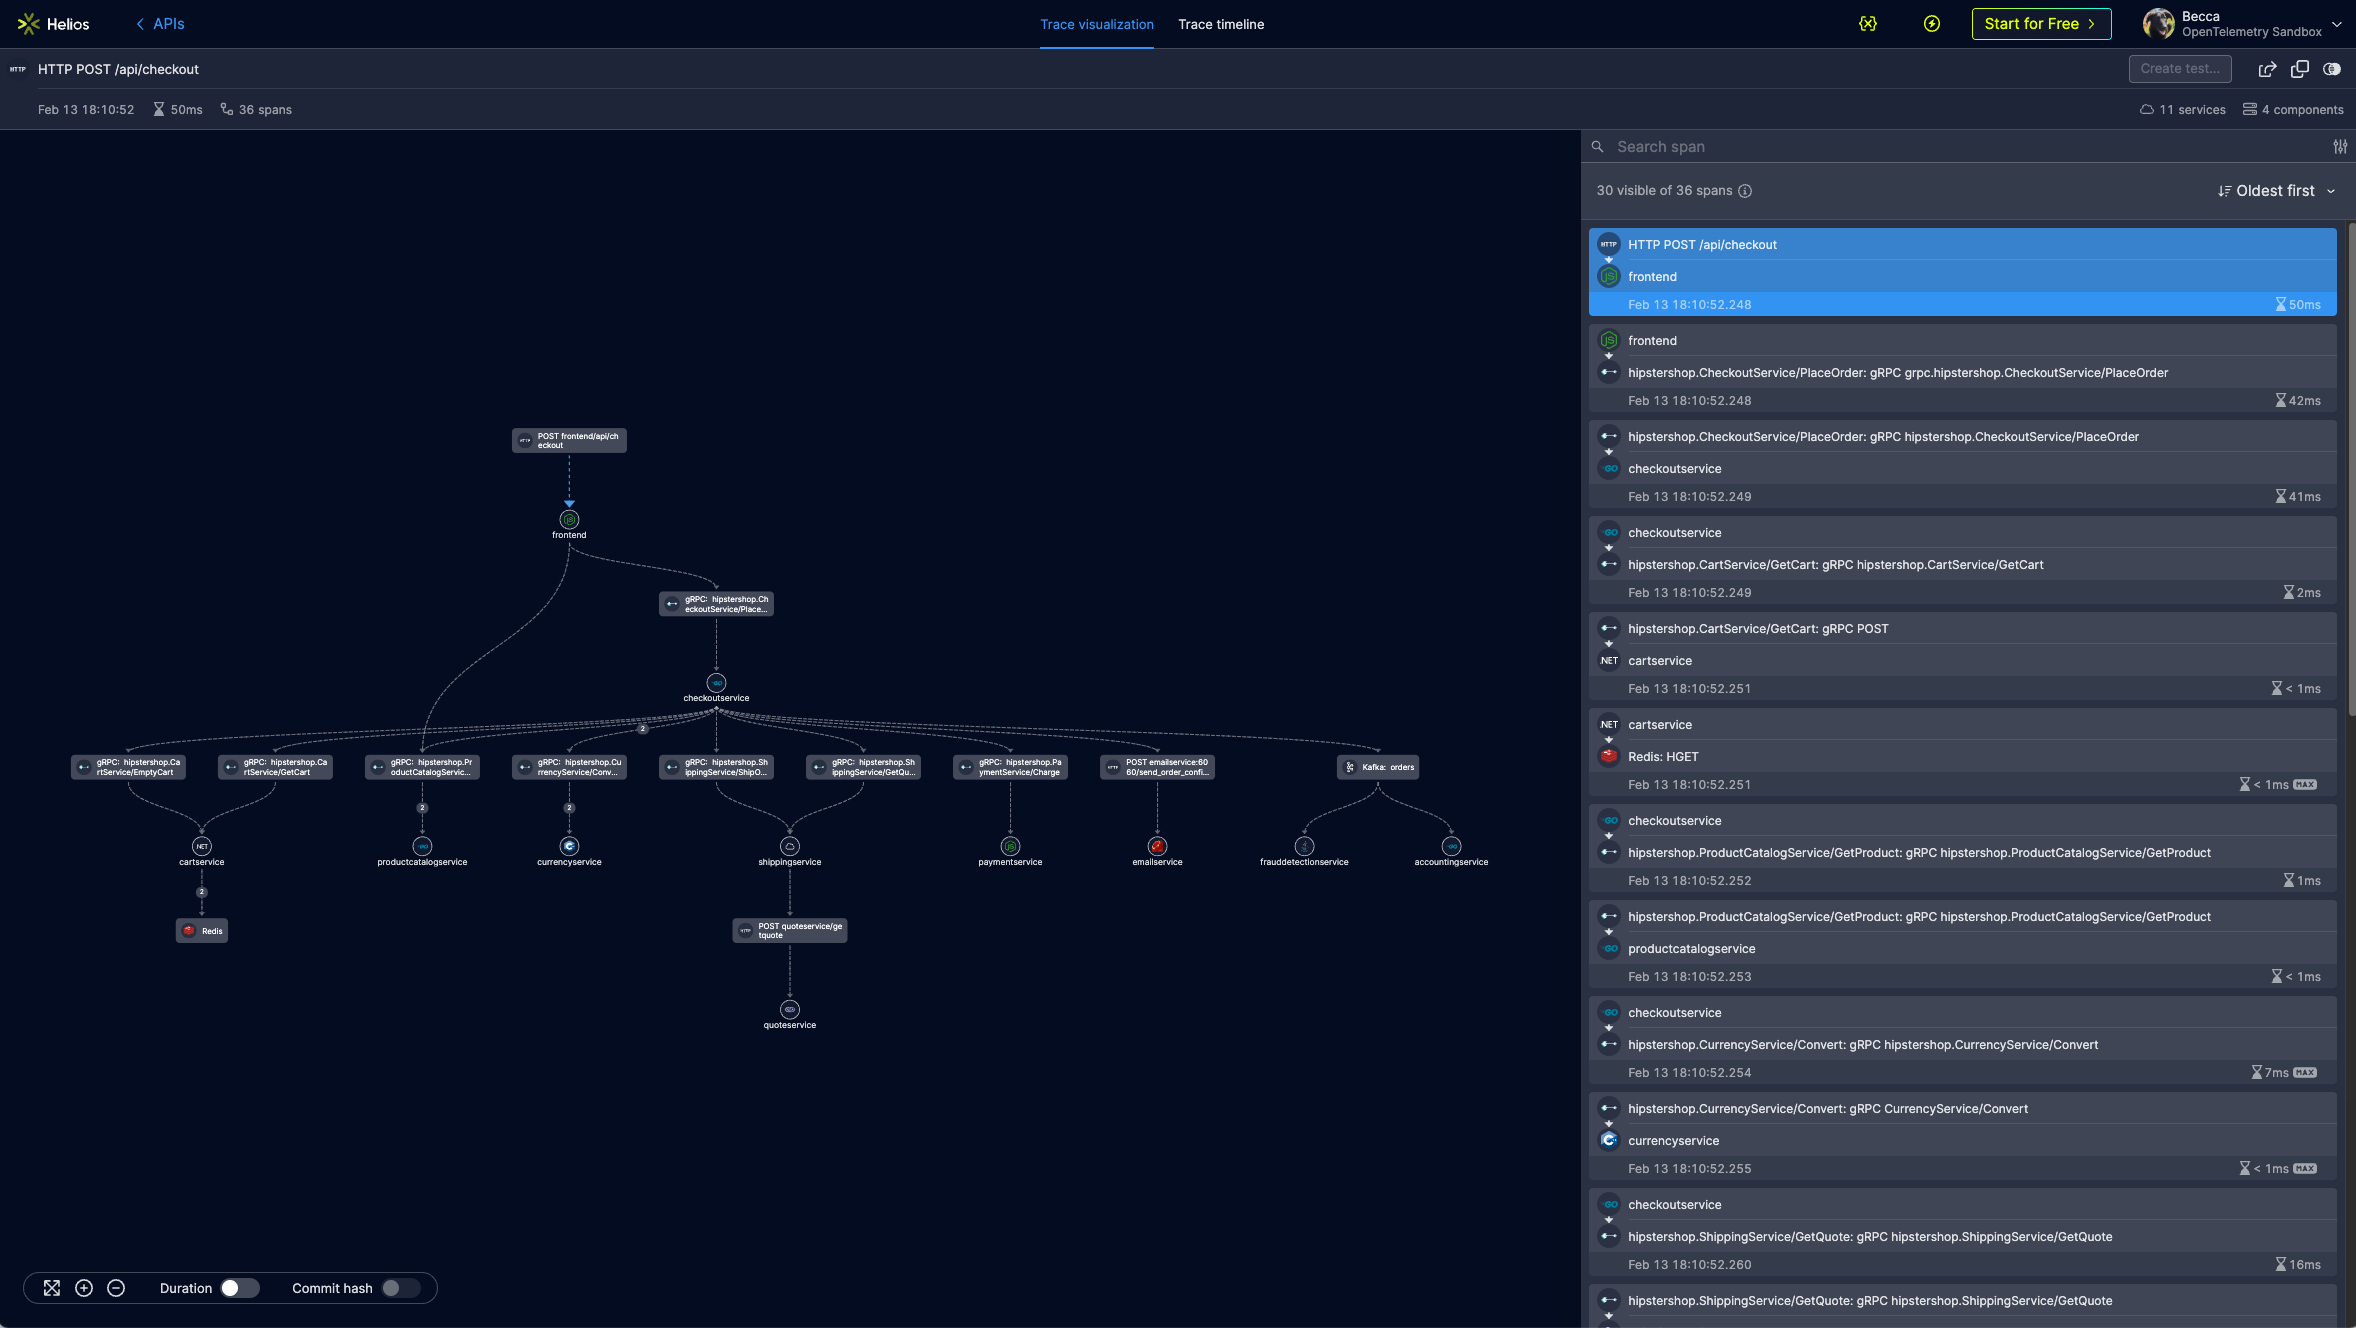
Using the Helios trace visualization, you can see and understand the architecture, and identify workflows and dependencies in a straight-forward and intuitive manner. If you drill down further, you can get insights into issues and errors, allowing developers to quickly pinpoint an issue and solve it.
Jaeger tracing visualization with Helios
Our OpenTelemetry trace visualization tool offers an easy way for developers leveraging Jaeger distributed tracing to experience visibility like never before into your system across microservices, serverless functions, databases, and third-party APIs. Now you can get a single source of truth for how data flows through your entire application, across any environment.
To use the Helios OpenTelemetry trace visualization tool, simply drop your Jaeger trace file into here and you’ll get a state-of-the-art E2E visualization. It’s free and doesn’t require any sign-up to use it.
With Helios’s advanced visualization tool for Jaeger traces, you can:
- See distributed tracing information in full context, including payloads, headers, and all span attributes
- Get actionable insights as early as in your local and integration environments, all the way to production
- Search for specific spans and see the duration of each span in a trace and the commit hash of each service
Using trace visualization to identify issues fast
When dev teams run into issues in their microservices they often have to launch an investigation, digging through logs and retracing their steps – a process which is generally quite manual. Organizations may have tools to help them track logs or may even leverage tracing to understand problems when they pop up in their infrastructure or development process. Where the Helios advanced trace visualization can help is to present trace information in an intuitive view that speeds up the troubleshooting process and significantly improves the overall developer experience.
Helios presents distributed tracing visualization so that devs can immediately pinpoint where problems are. It enables teams to gain specific insights, like what payload was sent when a particular piece of the trace failed. When using the Helios distributed tracing platform, developers can then quickly rerun the flow, reproduce it and analyze the result to solve the problem (the Helios platform even supports generating tests to keep issues from reoccurring).
We’ve come across different use cases where our customers used our convenient trace visualization to find and fix bugs quickly and easily. Some of these use cases include:
- Getting visibility into your backend during UI testing
When it comes to E2E testing in distributed/cloud-native architectures, browser-based tools like Cypress are limited. When you have to troubleshoot a failed test it can be difficult since the UI provides little visibility into what happens in the backend.
The Helios distributed tracing platform integrates with Cypress to give you visibility into async processes during UI testing by connecting what happens in a browser across distributed traces from the backend. Tracing a flow from the browser will include all downstream operations in the same trace, giving you a complete view of what happens behind the scenes. This visibility makes troubleshooting much faster and smoother for developers.
- Applying observability to 3rd party integrations
Developers often encounter faulty flows in the process of integrating with 3rd parties. Unless you catch and log the error received, you have to debug the code, breakpoint on the interaction itself, and start examining its result if you want to understand the root cause. This can be tedious, depending on the complexity of the implemented flow.
The Helios distributed tracing platform enables third-party integration observability to help streamline the detection of root cause errors, providing end-to-end visibility into your app flows as early as in your local dev environment. Leveraging distributed tracing in Helios, especially when integrating with third-party apps, leads to significant time savings and a much smoother experience.
- Replaying E2E flows across distributed applications
Replaying calls that are not HTTP in your distributed application is not a simple task. For example, if you wanted to send a message to Kafka in your local environment, you’d need to set up a service that communicates with Kafka.
The Helios distributed tracing platform enables you to replay requests to API endpoints, message queues, Lambda functions, CloudWatch events, K8s jobs, and other systems that are less accessible than easily-callable API endpoints. In Helios, you can see the specific flow (trace) you need to replay, then in 1-click you can generate the flow trigger code.
Why should developers care about observability?
The short answer is because it provides visibility and insights into what’s going on in your app. Observability is the ability to understand the internal state and behavior of an application, and how it interacts with its environment. This includes monitoring and analyzing metrics, traces, and logs to gain insight into the performance, availability, and correctness of the application. Observability is key to troubleshooting and debugging issues, identifying performance bottlenecks, and understanding how users interact with the app. It can also help in identifying and preventing errors and outages, and in ensuring that the application meets its SLA.
An observable application will have instrumentation that can be used to collect data on various aspects of the application, such as response times, error rates, and resource usage. This data can then be analyzed to identify patterns and trends, and to identify areas for improvement. It also includes the ability to monitor and understand the impact of the application on other systems and services in the environment, such as databases, service, caches and other dependent systems.
In today’s reality of increased complexity in the stack and architecture (by the very definition of microservices) on one hand, and a strong pull to improve efficiency and deliver business value with constrained R&D resources faster on the other – developers can no longer ignore the important role observability plays in enabling dev teams move faster.
Why we embrace OpenTelemetry
OpenTelemetry is an open-source project that provides a set of APIs and libraries for collecting, storing, and analyzing telemetry data for cloud-native applications. It provides a common framework for distributed tracing, metrics, and logging, and aims to make it easier for developers to understand the performance and behavior of their applications.
At Helios, we build upon OpenTelemetry’s instrumentation framework to provide insight into your end-to-end app flows. With the Helios distributed tracing platform, dev teams can benefit from advanced trace visualizations and perform actions like quickly reproducing failures, automatically generating tests, and collaborating with teammates. These easily-accessible capabilities help to mitigate many of the common challenges associated with moving to and building in microservices-based, distributed architectures.
The Helios team is an active member of the OpenTelemetry community, and we try to contribute back as much as possible. In addition to improvements in various bits of functionality, we’ve also made the OpenTelemetry Demo easily available in the Helios OpenTelemetry Sandbox. No need to install, run, or fork anything in order to use it. Read more about why we believe the OpenTelemetry Demo is such an important milestone for the community here.
Try Helios for free
In this blog post we discussed the power of distributed tracing, the importance of intuitive visualization in distributed applications to mitigate app flow blindness, how to use the Helios advanced trace visualization tool with Jaeger tracing, leveraging trace visualization to troubleshoot issues fast – and finally the critical role observability (and specifically, OpenTelemetry) plays in helping developers get their job done in today’s complex architectures. We also walked through the benefits and capabilities of the Helios OpenTelemetry trace visualization tool for Jaeger distributed tracing.
The Helios distributed tracing platform leverages OpenTelemetry to bring together your application flows and ultimately save time and improve developer experience and productivity. Want to try it for yourself? Get started today with Helios in your local environment for free.


