OpenTelemetry is an open-source project under the Cloud Native Computing Foundation (CNCF) that provides a standard and robust way to collect, process and export observability data for modern, cloud-native systems. It is designed to help developers and ops gain better visibility into their applications and infrastructure, allowing them to detect and troubleshoot issues more effectively. With OpenTelemetry, developers can collect telemetry data from various sources, including metrics, traces, and logs, and send it to their preferred observability backend for analysis.
Below, we explore OpenTelemetry in depth, including its architecture, components, use cases and best practices. We will also discuss the benefits of adopting OpenTelemetry and how it integrates with other observability tools and platforms. After reading this page you will have the knowledge and resources you need to leverage OpenTelemetry to achieve better visibility and performance for your applications and systems.
What is OpenTelemetry?
OpenTelemetry is an open-source collection of tools, APIs and SDKs for generating, collecting and exporting telemetry data (traces, metrics and logs) from cloud-native applications, microservices and distributed systems. With this data and the consequential observability into distributed systems, developers can troubleshoot, debug, test and monitor application performance. These actions improve application reliability and scalability and developer velocity.
For example, OpenTelemetry metrics include counters, gauges, histograms, and summaries. These metric types help to capture different aspects of the system’s behavior, such as the rate of requests, the size of requests, and the distribution of response times.
OpenTelemetry is language-agnostic, vendor-agnostic and cloud-agnostic. This means it can support all major programming languages and cloud providers.
OpenTelemetry logging and OpenTelemtery tracing is supported through ist several components, including the OpenTelemetry API, the OpenTelemetry SDK and the OpenTelemetry Collector. The API defines the interfaces for generating and collecting telemetry data. The SDK provides the implementation of these interfaces for specific programming languages. The Collector collects telemetry data from various sources, applies transformation and enrichment to the data and exports it to various telemetry backends.
While OpenTelemetry wasn’t the first open source solution to handle telemetry data, it created an instrumentation standard for the developer ecosystem and is widely used. In addition, a rich ecosystem of tools has been developed around it.
What is Context Propagation in OpenTelemetry?
An important aspect of the way OpenTelemetry works is context propagation. Context propagation refers to the mechanism used to pass contextual information, such as trace and span IDs, in transactions across distributed systems and services. Context propagation is essential in distributed systems as it allows developers to trace the requests that flow through the architecture’s various services and components. This provides observability, which can help identify bottlenecks and issues that may impact application performance and reliability.
In OpenTelemetry, context propagation is achieved through the use of context objects. The medium used for transporting the context object depends on the communication type, for example headers for HTTP communication, etc. The context object is propagated alongside requests as they traverse different services and components, allowing developers to correlate requests across the entire distributed system.
OTel supports multiple context propagation mechanisms, including through instrumentation libraries and the W3C Trace Context specification. These propagation formats define the format and structure of the context objects, making it easy to propagate them across different programming languages and platforms.
OpenTelemetry vs. OpenTracing

OpenTelemetry and OpenTracing are both open-source projects that provide tools and APIs for instrumentation data management. However, they differ from each other. OpenTracing is an API developed solely for generating trace data. It supports several popular tracing backends, including Jaeger and Zipkin.
OpenTelemetry, on the other hand, is a merger of OpenTracing and another project – OpenCensus. Unlike OpenTracing, OpenTelemetry supports multiple telemetry data types: traces, metrics, and logs, and provides a unified API and data model for these data types. Just like OpenTracing, it also supports Jaeger, Zipkin and other backends.
OTeL also provides a centralized collector that can collect telemetry data from multiple sources and export it to these telemetry backends, as well as integrations and plugins for various programming languages and platforms.
OpenTelemetry vs. Prometheus

OpenTelemetry and Prometheus are both tools used for monitoring and collecting data in software systems, but they have some key differences. While OTEL helps with instrumenting code for generating telemetry data, Prometheus is a tool for metrics monitoring. In fact, Prometheus is a backend that can be used by OpenTelemetry for storing and querying metrics. It’s no surprise then, that Prometheus has a visualization layer and OpenTelemtry does not. Finally, OTeL does not provide any storage options, while Prometheus has short-term storage options.
OpenTelemetry Architecture and Components

OpenTelemetry’s architecture is modular and is made up of several components that work together to generate, collect and export telemetry data. It comprises three layers: instrumentation, collection, and exporting.
- The Instrumentation Layer: The APIs and SDKs for instrumenting applications and generating telemetry data. Through this layer, developers can add telemetry generation abilities to their applications.
- The Collection Layer: This layer collects and processes telemetry data generated by the instrumentation layer. It includes the OpenTelemetry Collector, which is a centralized component that can collect telemetry data from various sources, enrich it, and then export it to telemetry backends.
- The Export Layer: The layer that exports telemetry data to telemetry backends, like tracing systems, metrics databases and logging platforms. OpenTelemetry supports several built-in exporters for popular backends, like Jaeger, Zipkin, Prometheus, and Elasticsearch. It also provides a standard interface for creating custom exporters.
How Does OpenTelemetry Work?
OpenTelemetry Instrumentation
Instrumentation in OTel can be manual or automated. Manual instrumentation in OpenTelemetry involves explicitly adding code to your application to collect telemetry data. This is useful in situations where automatic instrumentation is not available or does not provide sufficient data. For example, if you are using a third-party library that does not have automatic instrumentation, you may need to manually instrument it to collect telemetry data. However, it is time-consuming and error-prone.
OpenTelemetry's Instrumentation Libraries
OpenTelemetry provides a set of instrumentation libraries for the commonly-used frameworks and libraries. These libraries enable developers to instrument their applications and generate telemetry data. Each library is language-specific and supports integrations with various frameworks, databases and messaging systems. The most popular client libraries are supported by the OTeL community,
OpenTelemetry Java Instrumentation
Supports popular Java frameworks, like Spring, Hibernate and JAX-RS, and libraries, such as Kafka, gRPC, and JDBC. Click to learn more about OpenTelemetry Java.
OpenTelemetry .NET Instrumentation
Supports automatic instrumentation for popular .NET frameworks, like ASP.NET Core, Entity Framework and gRPC, and libraries, such as Redis and RabbitMQ. Click to learn more about DotNet opentelemetry.
OpenTelemetry Node.js Instrumentation
Supports automatic instrumentation for popular Node.js frameworks, like Express, Hapi and Nest.js, and libraries, such as Redis and MongoDB. Click to learn more about Node.js OpenTelemetry distributed tracing .
OpenTelemetry Python Instrumentation
Supports automatic instrumentation for popular Python frameworks, like Flask, Django and Celery, and libraries, such as psycopg2 and SQLAlchemy. Click to learn more about OpenTelemetry Python.
OpenTelemetry Ruby Instrumentation
Supports automatic instrumentation for popular Ruby frameworks like Ruby on Rails and Sinatra, and libraries, such as Redis and Sequel.
OpenTelemetry Go Instrumentation
Supports automatic instrumentation for popular Go frameworks, such as Gin and Echo, and libraries, like gRPC and Redis
OpenTelemetry Auto-instrumentation

OpenTelemetry’s SDKs can automatically instrument an application without requiring any manual code changes. This means that developers can generate telemetry data without having to explicitly add instrumentation code to their applications.
OpenTelemetry provides auto-instrumentation by intercepting function calls or method invocations in the target application. When an intercepted function or method is executed, the SDK generates telemetry data and adds it to the current trace or metric.
Auto-instrumentation is particularly useful for generating telemetry data for third-party libraries or framework code that developers do not have control over. For example, if an application uses a third-party library to connect to a database, OpenTelemetry’s auto-instrumentation can automatically instrument the library’s database connection code and generate telemetry data for it.
OpenTelemetry Data Collection
Data collection is the process of collecting telemetry data from instrumented applications and forwarding it to backends for storage, analysis, and visualization. OpenTelemetry provides a flexible and extensible data collection architecture that allows developers to collect and process telemetry data using a variety of techniques and tools.
One of the key components of OpenTelemetry’s data collection architecture is the OpenTelemetry Collector. The Collector can be deployed alongside instrumented applications or as a standalone agent to collect and process telemetry data. It receives telemetry data from various sources, such as OpenTelemetry SDKs, agents, or exporters, and can export it to the backends, such as tracing systems, metrics systems, or log management systems.
The OpenTelemetry Collector supports a wide range of protocols and data formats. This makes it easy to integrate with different systems and tools. Some of the supported tools include Jaeger, Zipkin, Prometheus, Graphite, and Splunk. The Collector can also perform sampling and aggregation on telemetry data to reduce the volume of data being sent to backends and improve performance.
OpenTelemetry provides additional data collection components, such as SDKs, exporters, and agents. These elements allow developers to collect and process telemetry data in different environments and scenarios. For example, the OpenTelemetry SDKs provide a way to instrument applications directly, while the OpenTelemetry agents can be used to collect telemetry data from non-instrumented sources, such as logs or metrics.
OpenTelemetry for Kubernetes


OpenTelemetry can be used with Kubernetes to collect telemetry data from containerized applications running on a Kubernetes cluster. OpenTelemetry provides several Kubernetes-specific components and integrations that make it easy to collect and process telemetry data in a Kubernetes environment.
These include:
- Kubernetes-specific instrumentations: Kubernetes API server, etcd, kubelet, and more. These instrumentations can be used to generate telemetry data for operations like pod creation, deletion, and scaling.
- Kubernetes metadata injection: Automatically injecting Kubernetes-specific metadata, like pod name, pod namespace and container ID into telemetry data. This makes it easier to correlate telemetry data with Kubernetes-specific metadata and diagnose issues related to containerized applications.
- Kubernetes-aware sampling: Sampling telemetry data based on Kubernetes-specific metadata such as pod name, namespace, or service name. This can help reduce the volume of telemetry data being sent to backends and improve performance.
- Kubernetes deployment: OpenTelemetry can be deployed as a Kubernetes deployment or daemonset, making it easy to scale and manage OpenTelemetry components in a Kubernetes environment.
OpenTelemetry and Message Brokers


OpenTelemetry can be used with message brokers like Apache Kafka to collect telemetry data from message queues and topics. There are components and integrations that make it easy to instrument Kafka-based applications and generate telemetry data for message processing.
These include:
- Kafka client instrumentations: Can be used to generate telemetry data for message processing operations, like sending and receiving messages. The instrumentations can be added to Kafka client libraries such as the Java-based Kafka client, and can be configured to generate telemetry data for specific message queues or topics.
- Context propagation: Allows developers to propagate tracing and context information across Kafka message queues or topics. This makes it easier to correlate telemetry data with specific messages and diagnose performance issues related to message processing.
- Sampling and aggregation: Can be configured based on various criteria such as message queue or topic. They can be used to generate summarized or aggregated telemetry data for message processing operations.
OpenTelemetry Auto-instrumentation with Helios
- Java: A Java agent for dynamic bytecode modification,The Java agent is a separate JAR to the application JAR and performs the instrumentation. Learn more about how to get started with OTel-based tracing in Java.
- Python: Works by wrapping existing function implementations and extracting the necessary data. Here’s how to get started with tracing in Python.
- Node.js: Replaces function implementation of functions (i.e., monkey-patching). Learn more.
- Golang: OpenTelemetry instrumentation with Go is challenging, but not with Helios and our new approach.
- .Net: Learn how to instrument .Net with Helios
- Kubernetes: Helios supports Kubernetes-instrumentation functionalities.
OpenTelemetry Benefits


OpenTelemetry is a powerful observability framework that helps developers collect, process, and export telemetry data from their distributed systems. Here are some of the benefits of using OpenTelemetry:
1. No Vendor Lock
OpenTelemetry is a vendor-neutral and open-source observability framework. By using OpenTelemetry, developers and engineering groups are not bound to a single vendor. OpenTelemetry’s unified and standardized data format for telemetry data and the fact that it is open-source mean that the project cannot be controlled by any vendor.
In addition, OpenTelemetry provides exporters that allow users to export telemetry data to a wide variety of monitoring tools like Prometheus, Jaeger, and Zipkin. Users can also build their own exporters or use community-contributed exporters to export telemetry data to their preferred monitoring tool.
As a result, users gain flexibility to use OpenTelemetry the way they see fit and with the tools of their choice. They also have more ability to innovate with the solution, since they are not bound to using it the way the creators decided on. Finally, no vendor-lock provides future-proofing, i.e preventing costly future requirements that could arise when having to use a single vendor or when wanting to transfer between vendors.
2. The Power of Community
OpenTelemetry is an open-source project. This community-driven approach ensures that the framework benefits from contributions from a diverse group of individuals and organizations. This diversity can lead to innovation, improved quality and broader adoption of the project. It also ensures the project meets the needs of its users, since its users are also its developers.
Having a large and diverse community of contributors can also encourage rapid development and iteration. New features and improvements can be proposed, developed and reviewed quickly, leading to a more responsive and evolving project.
Finally, an open-source project is free to use, which lowers costs for users and also prevents vendor lock-in.
3. Unified Standards for Collections
OpenTelemetry provides a standard way to instrument, collect, and export telemetry data across various languages, platforms, and cloud providers. This standardization ensures that telemetry data is collected and reported in a consistent manner across different environments and systems, which reduces friction and makes it easier to use.
4. Semantic Conventions
The creation of semantic conventions by OpenTelemetry provides several advantages for the observability industry. These include the frictionless experience provided by a consistent format, interoperability between different monitoring tools and platforms without requiring custom integrations, ease of use and contextual understanding, for better decision-making.
Making OpenTelemetry Actionable - Visualization, Data and Insights
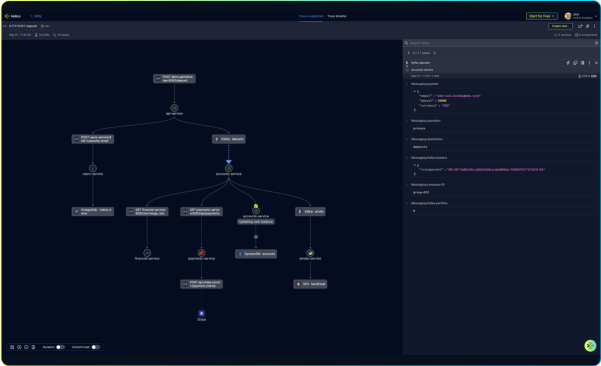
Helios is a developer platform that increases developer velocity when building cloud-native applications. With Helios, developers can get a full view of their API inventory, reproduce failures, and automatically generate tests, from local to production environments. This makes Helios a valuable solution for using with OpenTelemetry.
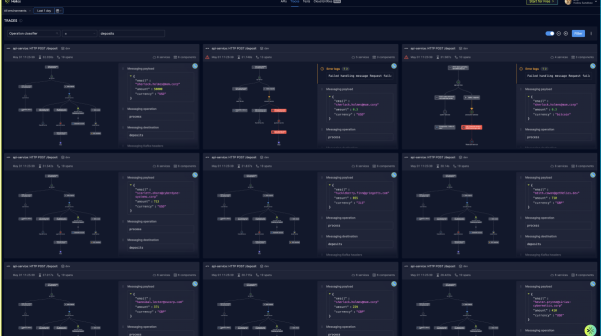
By exporting OTeL data to Helios, developers can make better sense out of their tracing data, with visibility and actionable insights that accelerate troubleshooting. For example, Helios can automatically collect DB queries, resulting in less time writing logs. Helios also provides an auto-generated service map for onboarding and helping teams understand what needs to be fixed where, drills down into logs and traces analysis for faster resolution and automates the test creation process, cutting it down from days to hours.
Benefits of OTel
Improved Observability of Applications
Shorter MTTR
Enhanced Customer Experience
Distributed Tracing
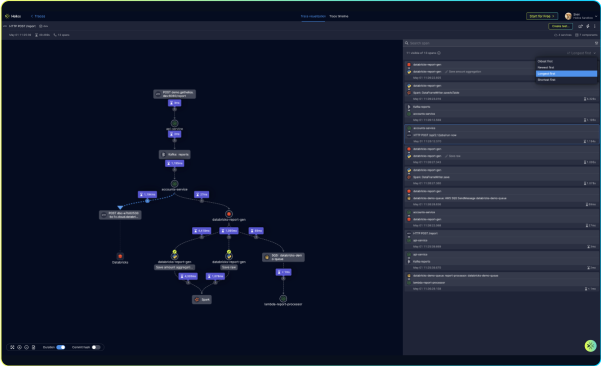
With OpenTelemetry, developers can trace requests across different services and components, gaining visibility into the performance of each component and the overall system. To use OpenTelemetry for distributed tracing, developers instrument their code to generate traces. These traces are collected and sent to a tracing backend, such as Jaeger, Zipkin, or Helios, where they are analyzed and visualized.
Visualization includes viewing traces in a timeline, understanding dependencies between different components, identifying performance bottlenecks, and detecting errors and exceptions. With OpenTelemetry, developers can gain deep insights into the behavior of distributed systems, enabling them to optimize performance and improve reliability.
Metrics Collection and Analysis
Developers can use OpenTelemetry to collect and analyze metrics from various sources, such as applications, servers, and infrastructure components. This includes measuring request rates, response times, error rates and resource usage. These metrics are then collected and sent to a metrics backend, like Prometheus or Graphite.
Once the metrics are collected, various visualization tools can be used to analyze the data. This can include viewing metrics in graphs and charts, setting up alerts and thresholds and detecting anomalies and trends. This enables them to optimize resource usage, detect issues, and improve reliability over time.
Debugging
To use OpenTelemetry for debugging, developers can leverage its distributed tracing capabilities. By tracing requests as they flow through the system, developers gain visibility into the entire request path, including all the services and components involved. This can help identify where issues are occurring, and how they are impacting the overall system. Debugging is also enabled through log analysis.
Reproducing Issues
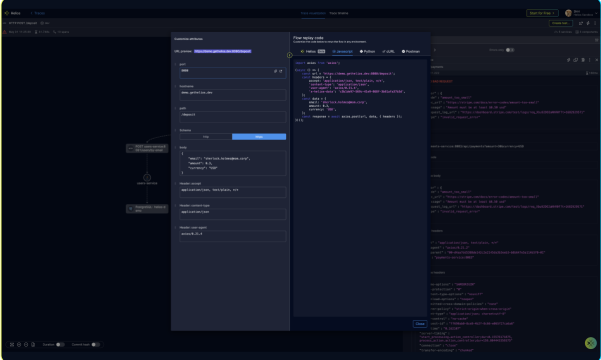
With OpenTelemetry, developers trace requests and collect detailed information about system behavior, making it easier to reproduce issues. For reproducing issues, developers can use the trace data to reproduce the problem by recreating the request path that led to the issue. This can be done by replaying the trace data in a controlled environment, allowing developers to debug the problem and identify the root cause. The contextual information collected also helps when reproducing issues.
API Observability
App Bottleneck Analysis
App bottleneck analysis is the process of identifying the bottlenecks in an application, to enable optimizing those areas. With OpenTelemtry, developers can analyze the data to identify slow and inefficient components.
Troubleshooting Message Brokers - Kafka and others
OpenTelemetry supports instrumenting message brokers’ code to generate traces and metrics. After exporting and analyzing the data, developers can quickly identify issues, diagnose the root cause of problems and troubleshoot message brokers more effectively, enabling them to improve system reliability and performance.
Microservices Testing
Testing is essential to ensure that applications work as expected and meet performance requirements before being released into production. To use OpenTelemetry for testing, developers can instrument their code to generate traces and metrics. With solutions like Helios, this data can be used to automatically-generate tests. during testing.
Collaboration
OpenTelemetry OpenSource Backends

As a vendor-neutral and open-source solution, OpenTelemetry is compatible with multiple open source and commercial tools that help enhance its capabilities. Two of the most popular tools are Jaeger and Zipkin.
Jaeger tracing
Jaeger is an open-source, OpenTelemetry-compatible distributed tracing tool. It is used as a backend for receiving and processing trace data collected by OpenTelemetry instrumentation libraries. OpenTelemetry provides integrations with Jaeger, allowing developers to easily send the data to Jaeger for analysis and visualization. Jaeger also integrates with other platforms like Elasticsearch, Kafka, and Cassandra.
By using Helios with Jaeger, developers can gain enhanced visibility, an API catalog – including HTTP, gRPC, GraphQL, Kafka, RabbitMQ, and serverless APIs – testing capabilities and e2e flow replaying. Use now for free – Trace visualization tool .
Zipkin
Elasticsearch
Elasticsearch is a search and analytics engine that provides a distributed, multitenant-capable full-text search engine with an HTTP web interface and schema-free JSON documents. It is commonly used as log storage as part of the ELK stack, and also serves as one of the supported storage types of Jaeger.
Prometheus
Prometheus is an open-source systems monitoring and alerting toolkit. The OpenTelemetry Prometheus Exporter allows to export OpenTelemetry metrics to Prometheus where they can later be used to create dashboards and alerts.
OpenTelemetry vs. APM Tools
OpenTelemetry and APM (Application Performance Monitoring) tools have some similarities, since they both provide observability features, but they also have some key differences.
- Open source vs. commercial: OpenTelemetry is an open-source framework that can be customized and extended by developers and organizations. APMs, on the other hand, are typically commercial products that require a license to use.
- Flexibility: OpenTelemetry is highly configurable and can be used to collect telemetry data from various sources. APMs, on the other hand, are typically designed to work with specific types of applications and infrastructure.
- Integration: OpenTelemetry provides integrations with a large variety of backend systems and tools, including tracing systems like Jaeger and Zipkin. APMs often have integrations with specific tools and services for monitoring and management.
- Use cases: OpenTelemetry data can be used for a variety of use cases, including debugging, troubleshooting, testing and others, before production and in production. APMs are most commonly used for production monitoring.
The Future of OpenTelemetry
According to an OpenTelemetry blog published in October 2022, OpenTelemetry had an incredible year in 2022. The project delivered various improvements, including more instrumentation for all languages, tracing stability in C++, Erlang, and other new languages, progress on auto-instrumentation, and major progress on logs.
In the future, the project aims to make OpenTelemetry easier to use, extend it to capture performance data from client applications, tie service performance to actual function performance and improve the contributor and maintainer experience. In addition, it will finish logs across all languages. These initiatives are already in progress, and the project will continue to focus on broadening out its existing functionality across all languages, scenarios, and integrations.
On this page
- What is OpenTelemetry?
- What is Context Propagation in OpenTelemetry?
- OpenTelemetry vs. OpenTracing
- OpenTelemetry VS Prometheus
- OpenTelemetry Architecture and Components
- How Does OpenTelemetry Work?
- OpenTelemetry Instrumentation
- OpenTelemetry Auto-instrumentation
- OpenTelemetry Data Collection
- OpenTelemetry for Kubernetes
- OpenTelemetry and Message Brokers
- OpenTelemetry Auto-instrumentation with Helios
- OpenTelemetry Benefits
- How Helios Makes OpenTelemetry Actionable for Developers
- Benefits of OTel
- + OpenTelemetry OpenSource Backends
- OpenTelemetry Tools
- The Future of OpenTelemetry
More OpenTelemetry resources
OTel is opening new possibilities for developers
OpenTelemetry (OTel) is emerging as the industry standard for system observability and distributed tracing across cloud-native…
How OpenTelemetry works under the hood in Javascript
OpenTelemetry (OTel) is an open source selection of tools, SDKs and APIs, that allows developers to collect and export traces, metrics and logs…
A guide to deploy OpenTelemetry in Java
OpenTelemetry (OTel), an open-source project under the Cloud Native Computing Foundation (CNCF), is a collection of tools, APIs and SDKs for…
Helping Go teams implement OpenTelemetry - a new approach
OpenTelemetry (OTel), the emerging industry standard for application observability and distributed tracing across cloud-native and distributed
Distributed tracing is a method for tracking all the operations within a distributed system that have been triggered by a specific request.
Increase your dev velocity
with actionable telemetry data


